
UAT release
This guide describes the upcoming portal update. Some screens or actions may differ in the current UAT portal.
Meter Monitoring & Telemetry Guide
Who is this for: Central Operations (Platform SERVICE) O&M Engineer (Developer SERVICE) System Operator (OPERATOR) Administrators Customer Off-taker (view only)
Prerequisites:
- Sites and meters are registered under a Solar Developer and Customer company.
- Live commands (Test connection, Read now, Backfill) require
meter.commandand an active HES service. - Telemetry repair (Auto-fill estimation, Manual edit, CSV import) requires
telemetry.sync(Platform/Developer Admin or Service).
1. Fleet Meter Monitoring (Meter Monitoring)
Open Meter Monitoring from the left sidebar to track meter health across your permitted portfolio, sorted worst-first so offline and unreporting meters surface immediately.
Four Top-Level Views
- Meters (default board): Lists every meter (plus sites without meters yet) sorted by severity (
Offline→Never reported→Not linked to HES→No meter→Online with alarms→Online→Switched off).- Status filter chips: Click Offline (silent > 1 hour,
commLostAt, or HES verification failed), Not reporting / not linked, With alarms, or Sites without a meter. - View as switcher: Aggregate rows by Developers (platform only), Offtakers, or Sites / Meters, plus a customer dropdown and Search box (matches site name, offtaker, serial, model, site code like
1-00012, orIP:Port).
- Status filter chips: Click Offline (silent > 1 hour,
- Regions: Interactive province & region cards displaying total kWp, GPS coordinates, and online percentage bars. Click any province card to filter the meter table below.
- Maintenance: Summary counts and filterable log of Swap, Maintenance, Calibration, and Inspection events, with CSV export and Log maintenance (requires
meter.write). - Alerts: Two sub-tabs: Active alerts (acknowledge, snooze, assign, and add notes) and Event history (filter by
Critical / Warning / Infoand Bangkok date range defaulting to the last 30 days, with CSV export).
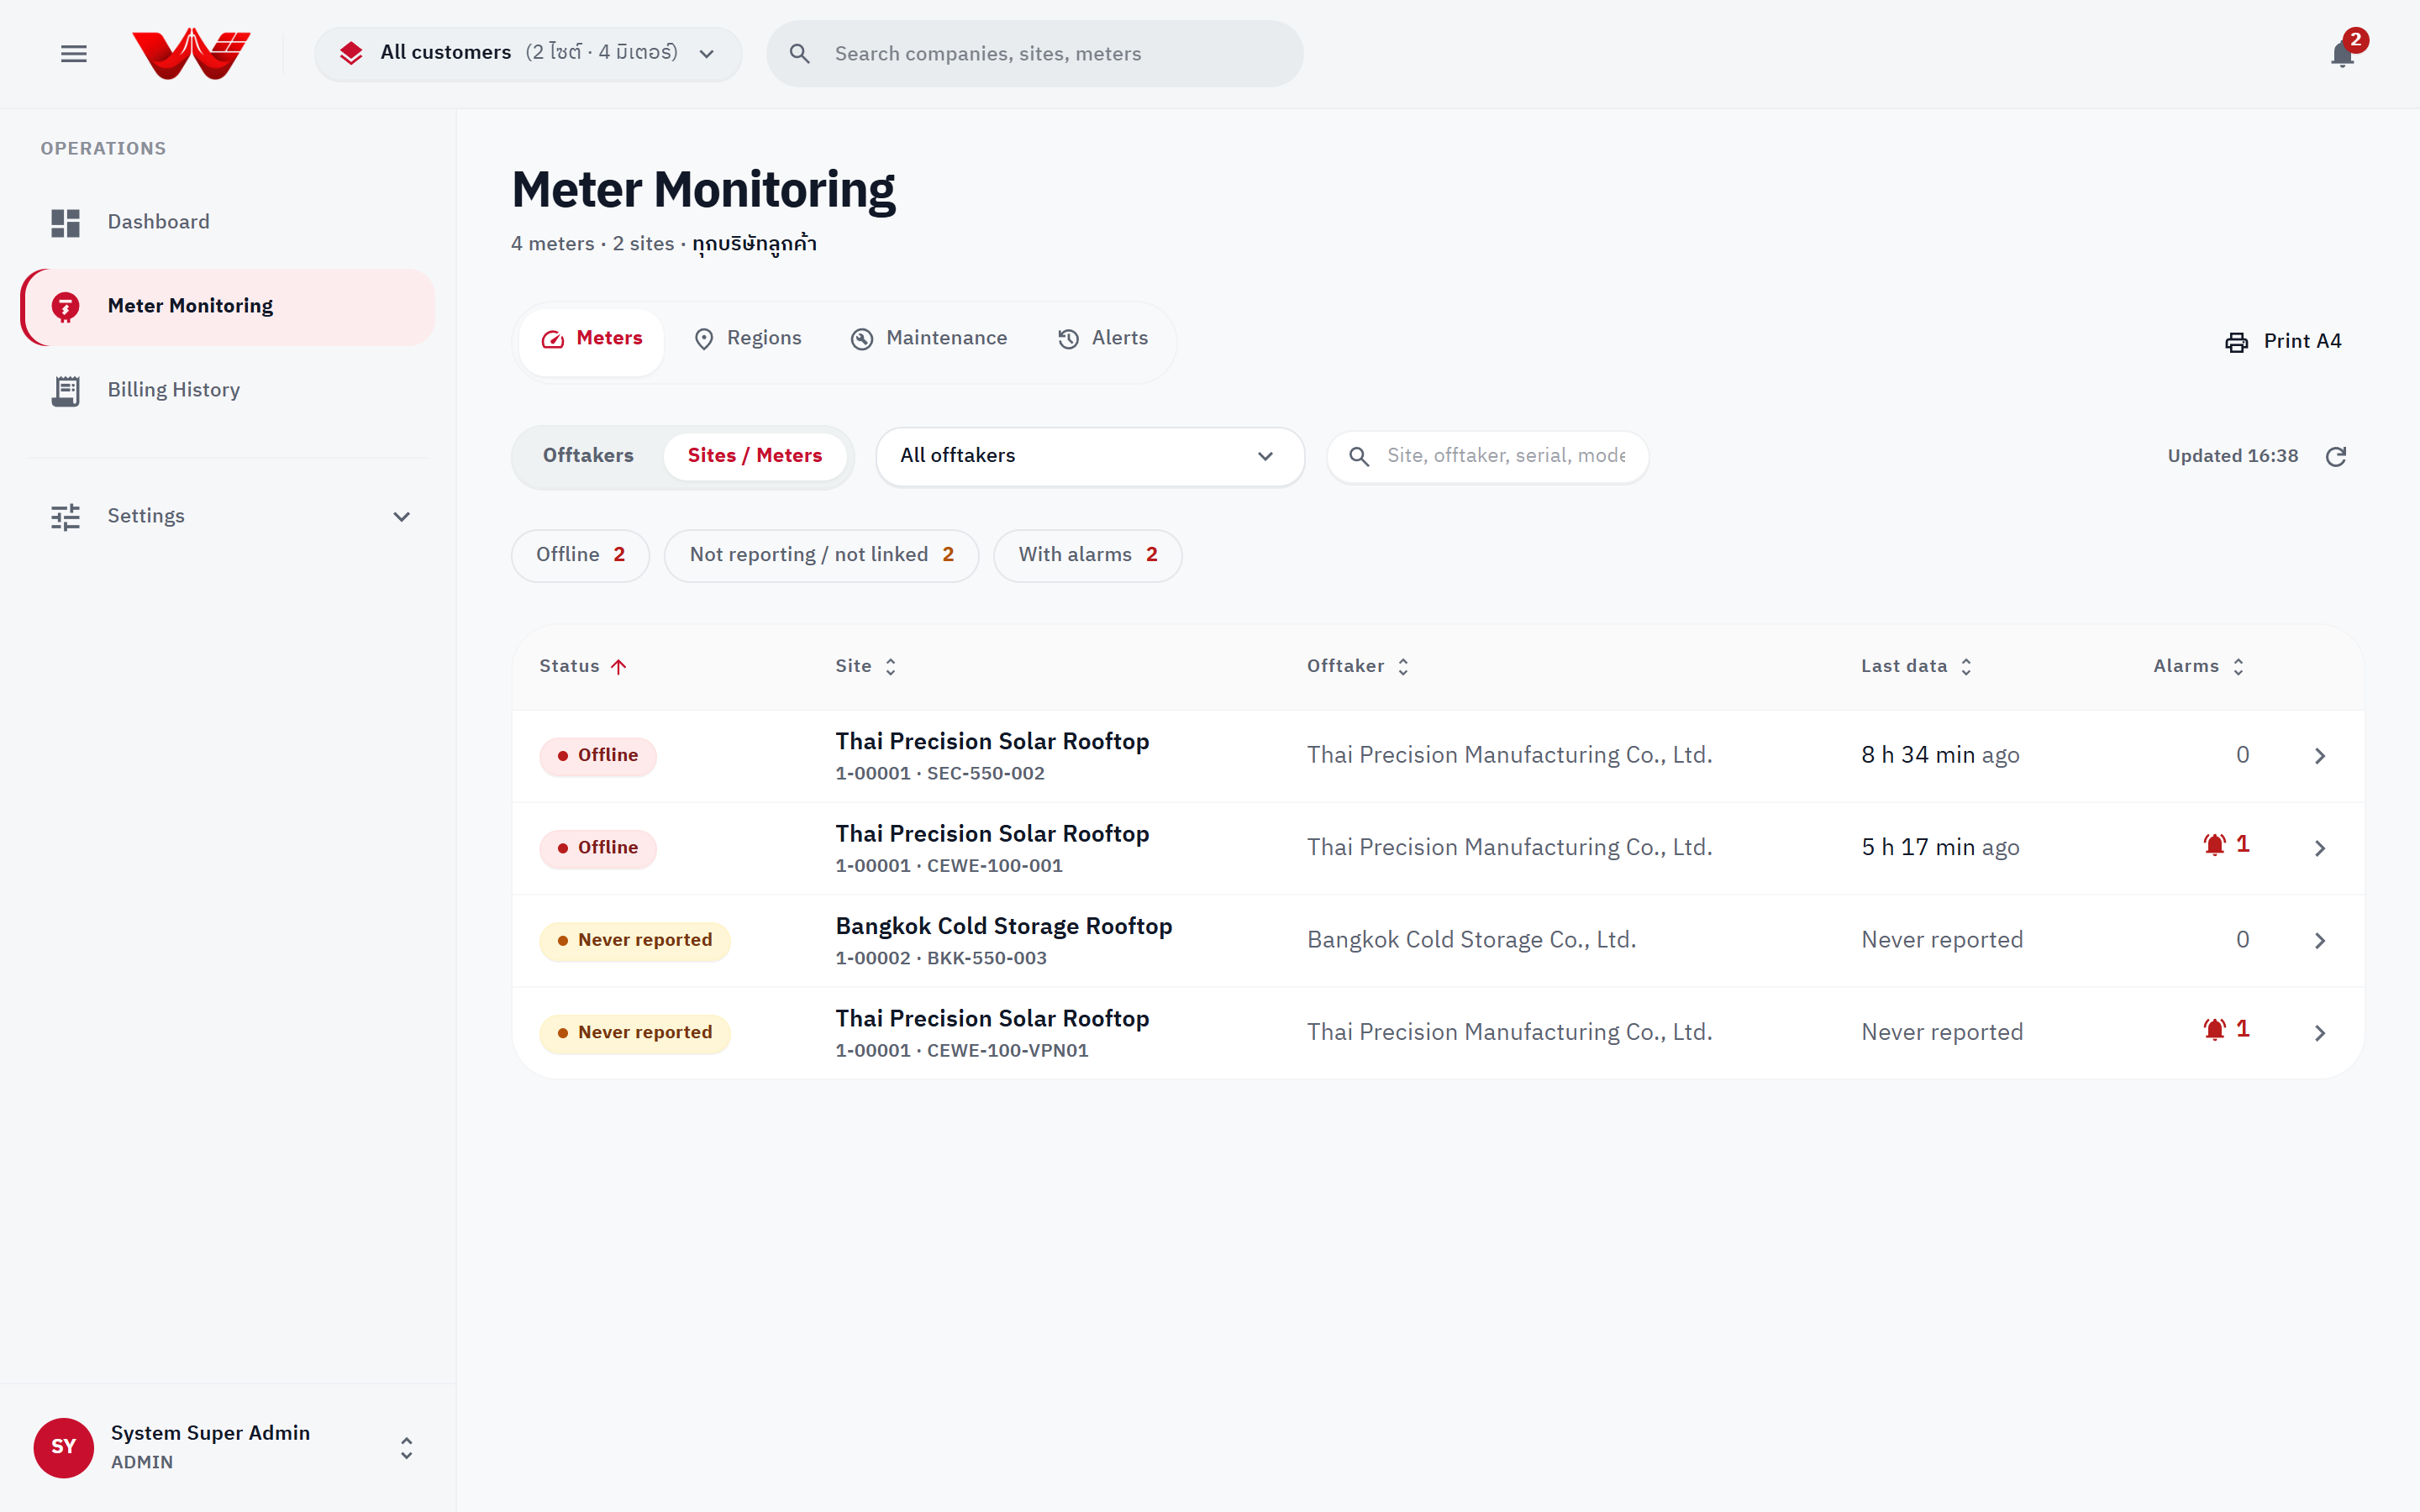 Figure 1: Meter Monitoring fleet board with view tabs, status filter chips, and worst-first meter table.
2. Drill-Down: Company Overview → Site Overview → Meter Detail
Company Overview
Open any customer or developer company to view:
- Energy period selector:
Today,Last 7 days,This month, orCustom(up to 93 days). - 4 Summary KPIs: Energy in selected period (
kWh), Meters recently contacted (reporting / active), Sites needing attention, and Company sites. - Needs attention panel: Direct links to sites missing a PPA, missing active meters, or with silent meters, plus a Company billing status summary and exportable site list.
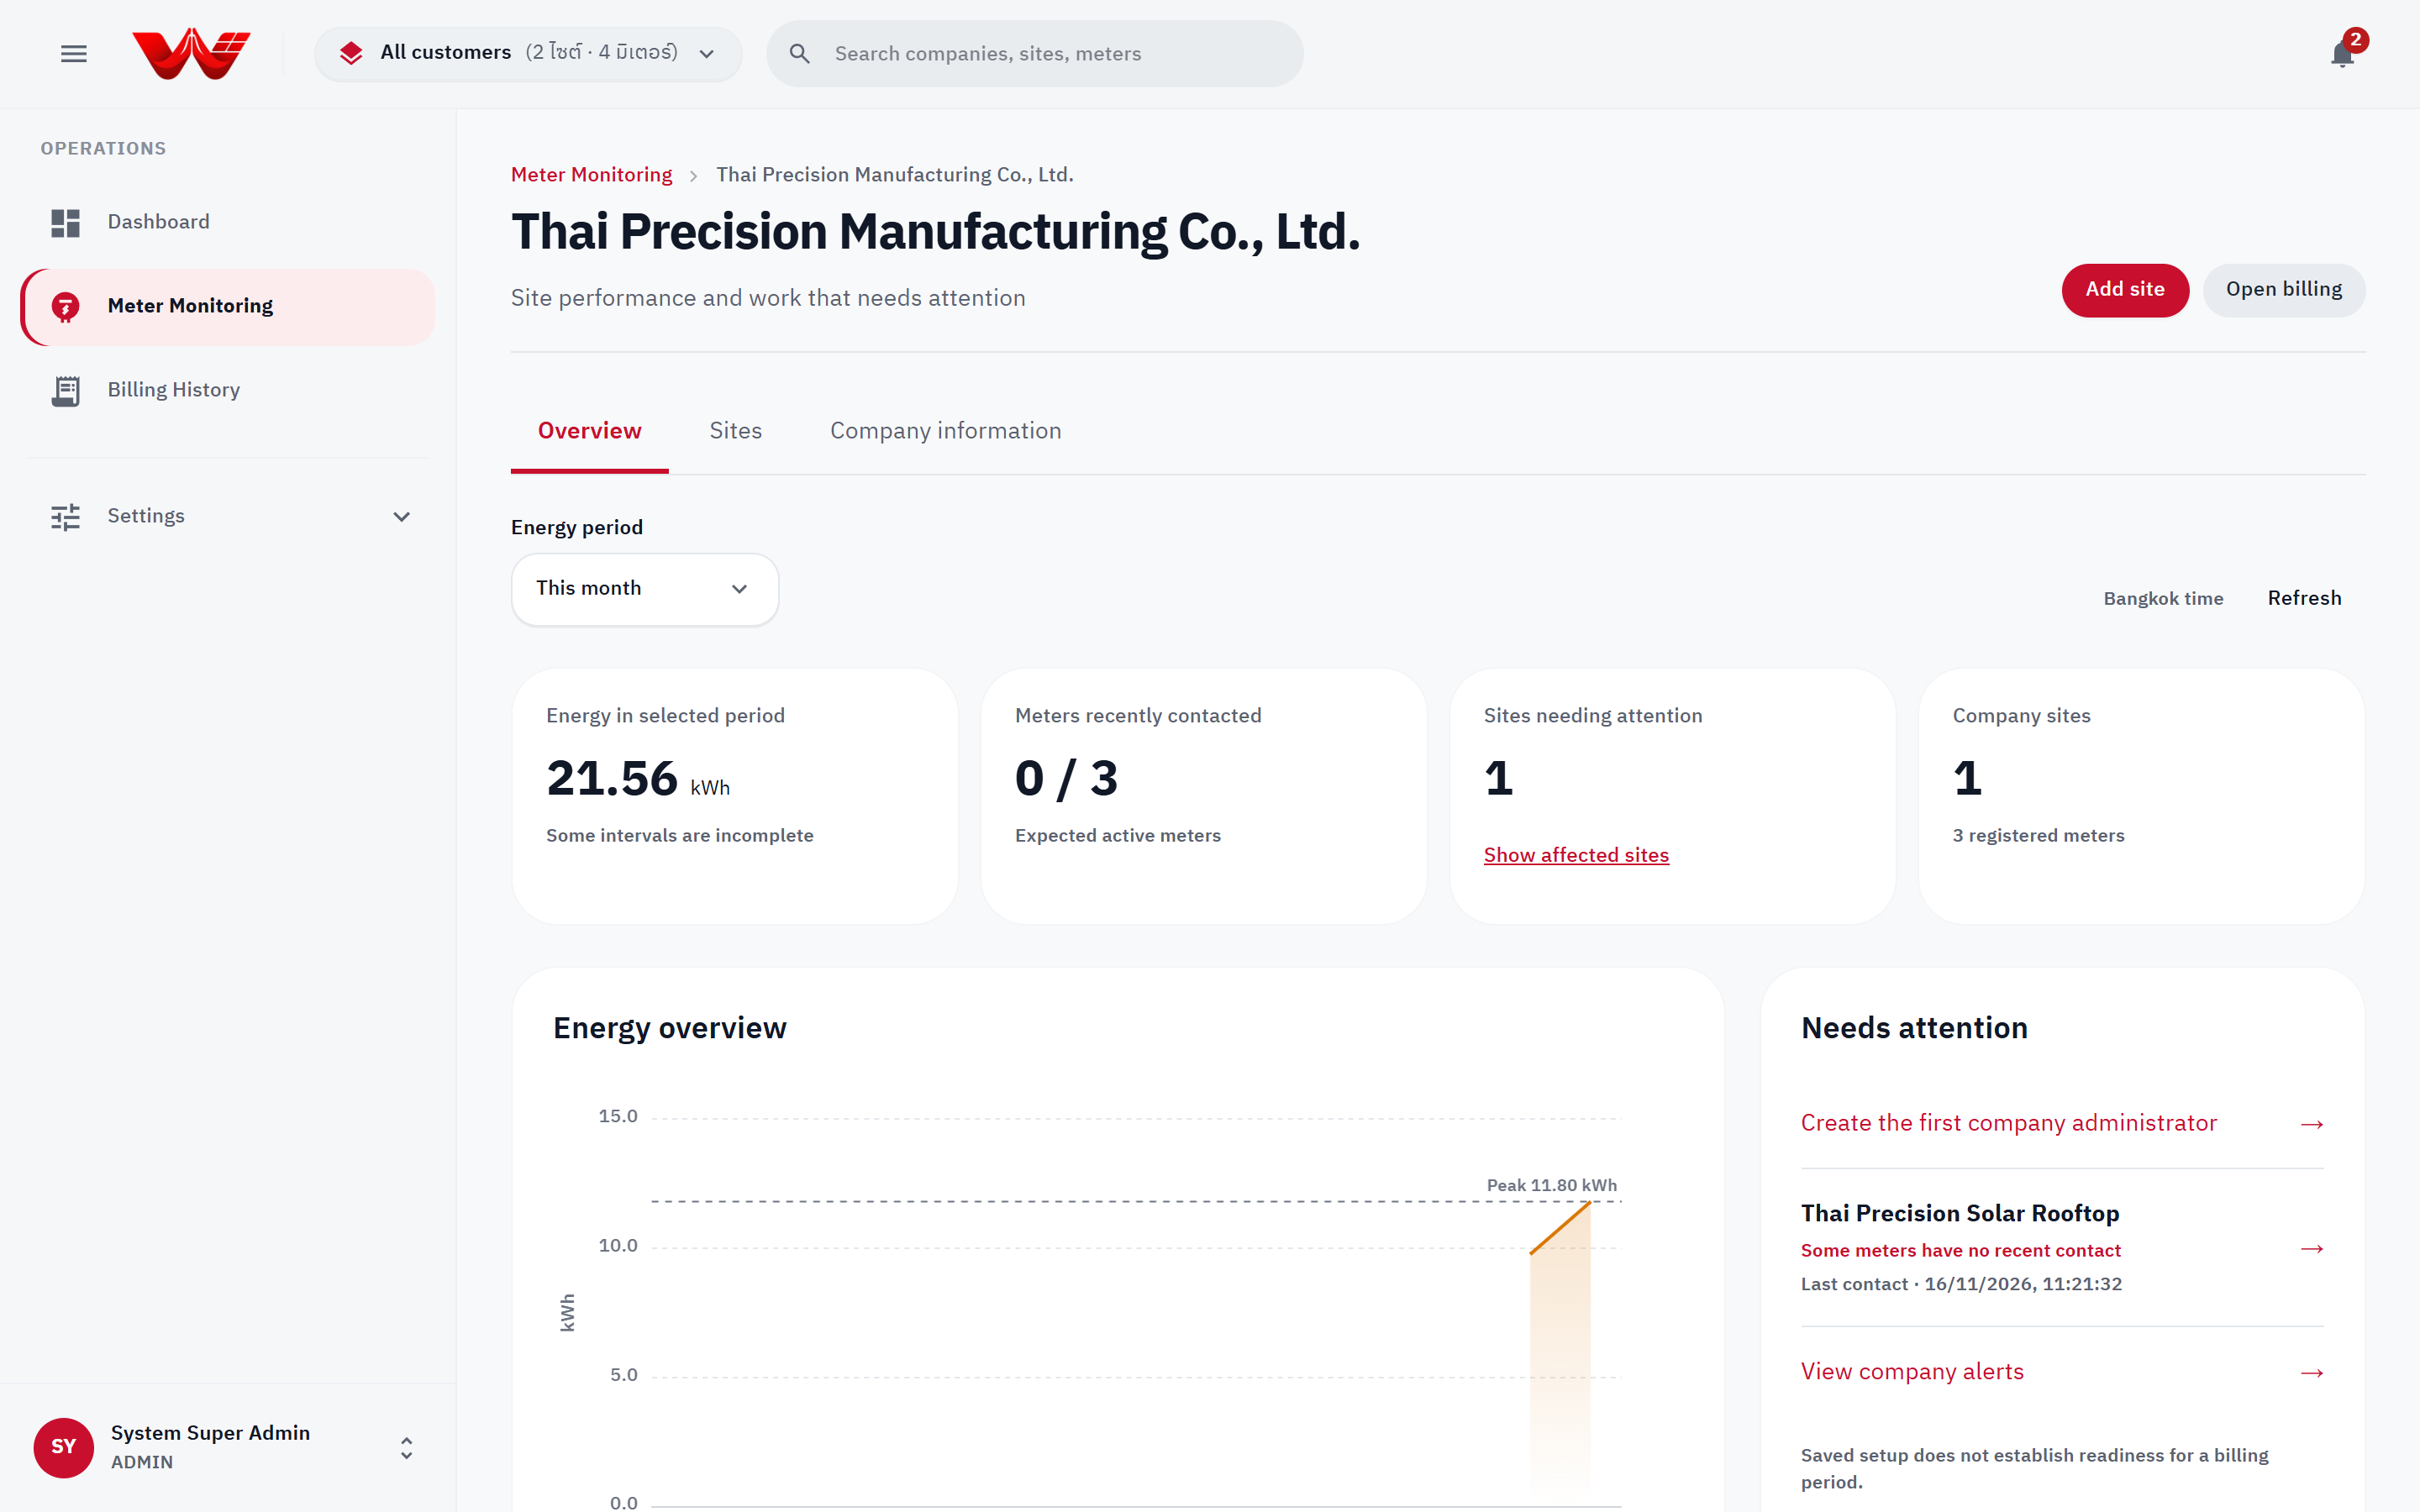 Figure 2: Company overview showing period energy trend, Needs attention items, billing snapshot, and site table.
Site Overview
Click any site to open its workspace tabs:
- Overview: Installed capacity (
kWp), registered meters, last contact timestamp, 7-day daily energy trend, and meter status list. - Data: Embedded 15-minute telemetry explorer scoped to the site.
- Meters: Site meter table and configuration actions (when opened from Settings).
- PPA: Contract terms and rates.
- Connectivity: VPN profile assignments for the site's meters.
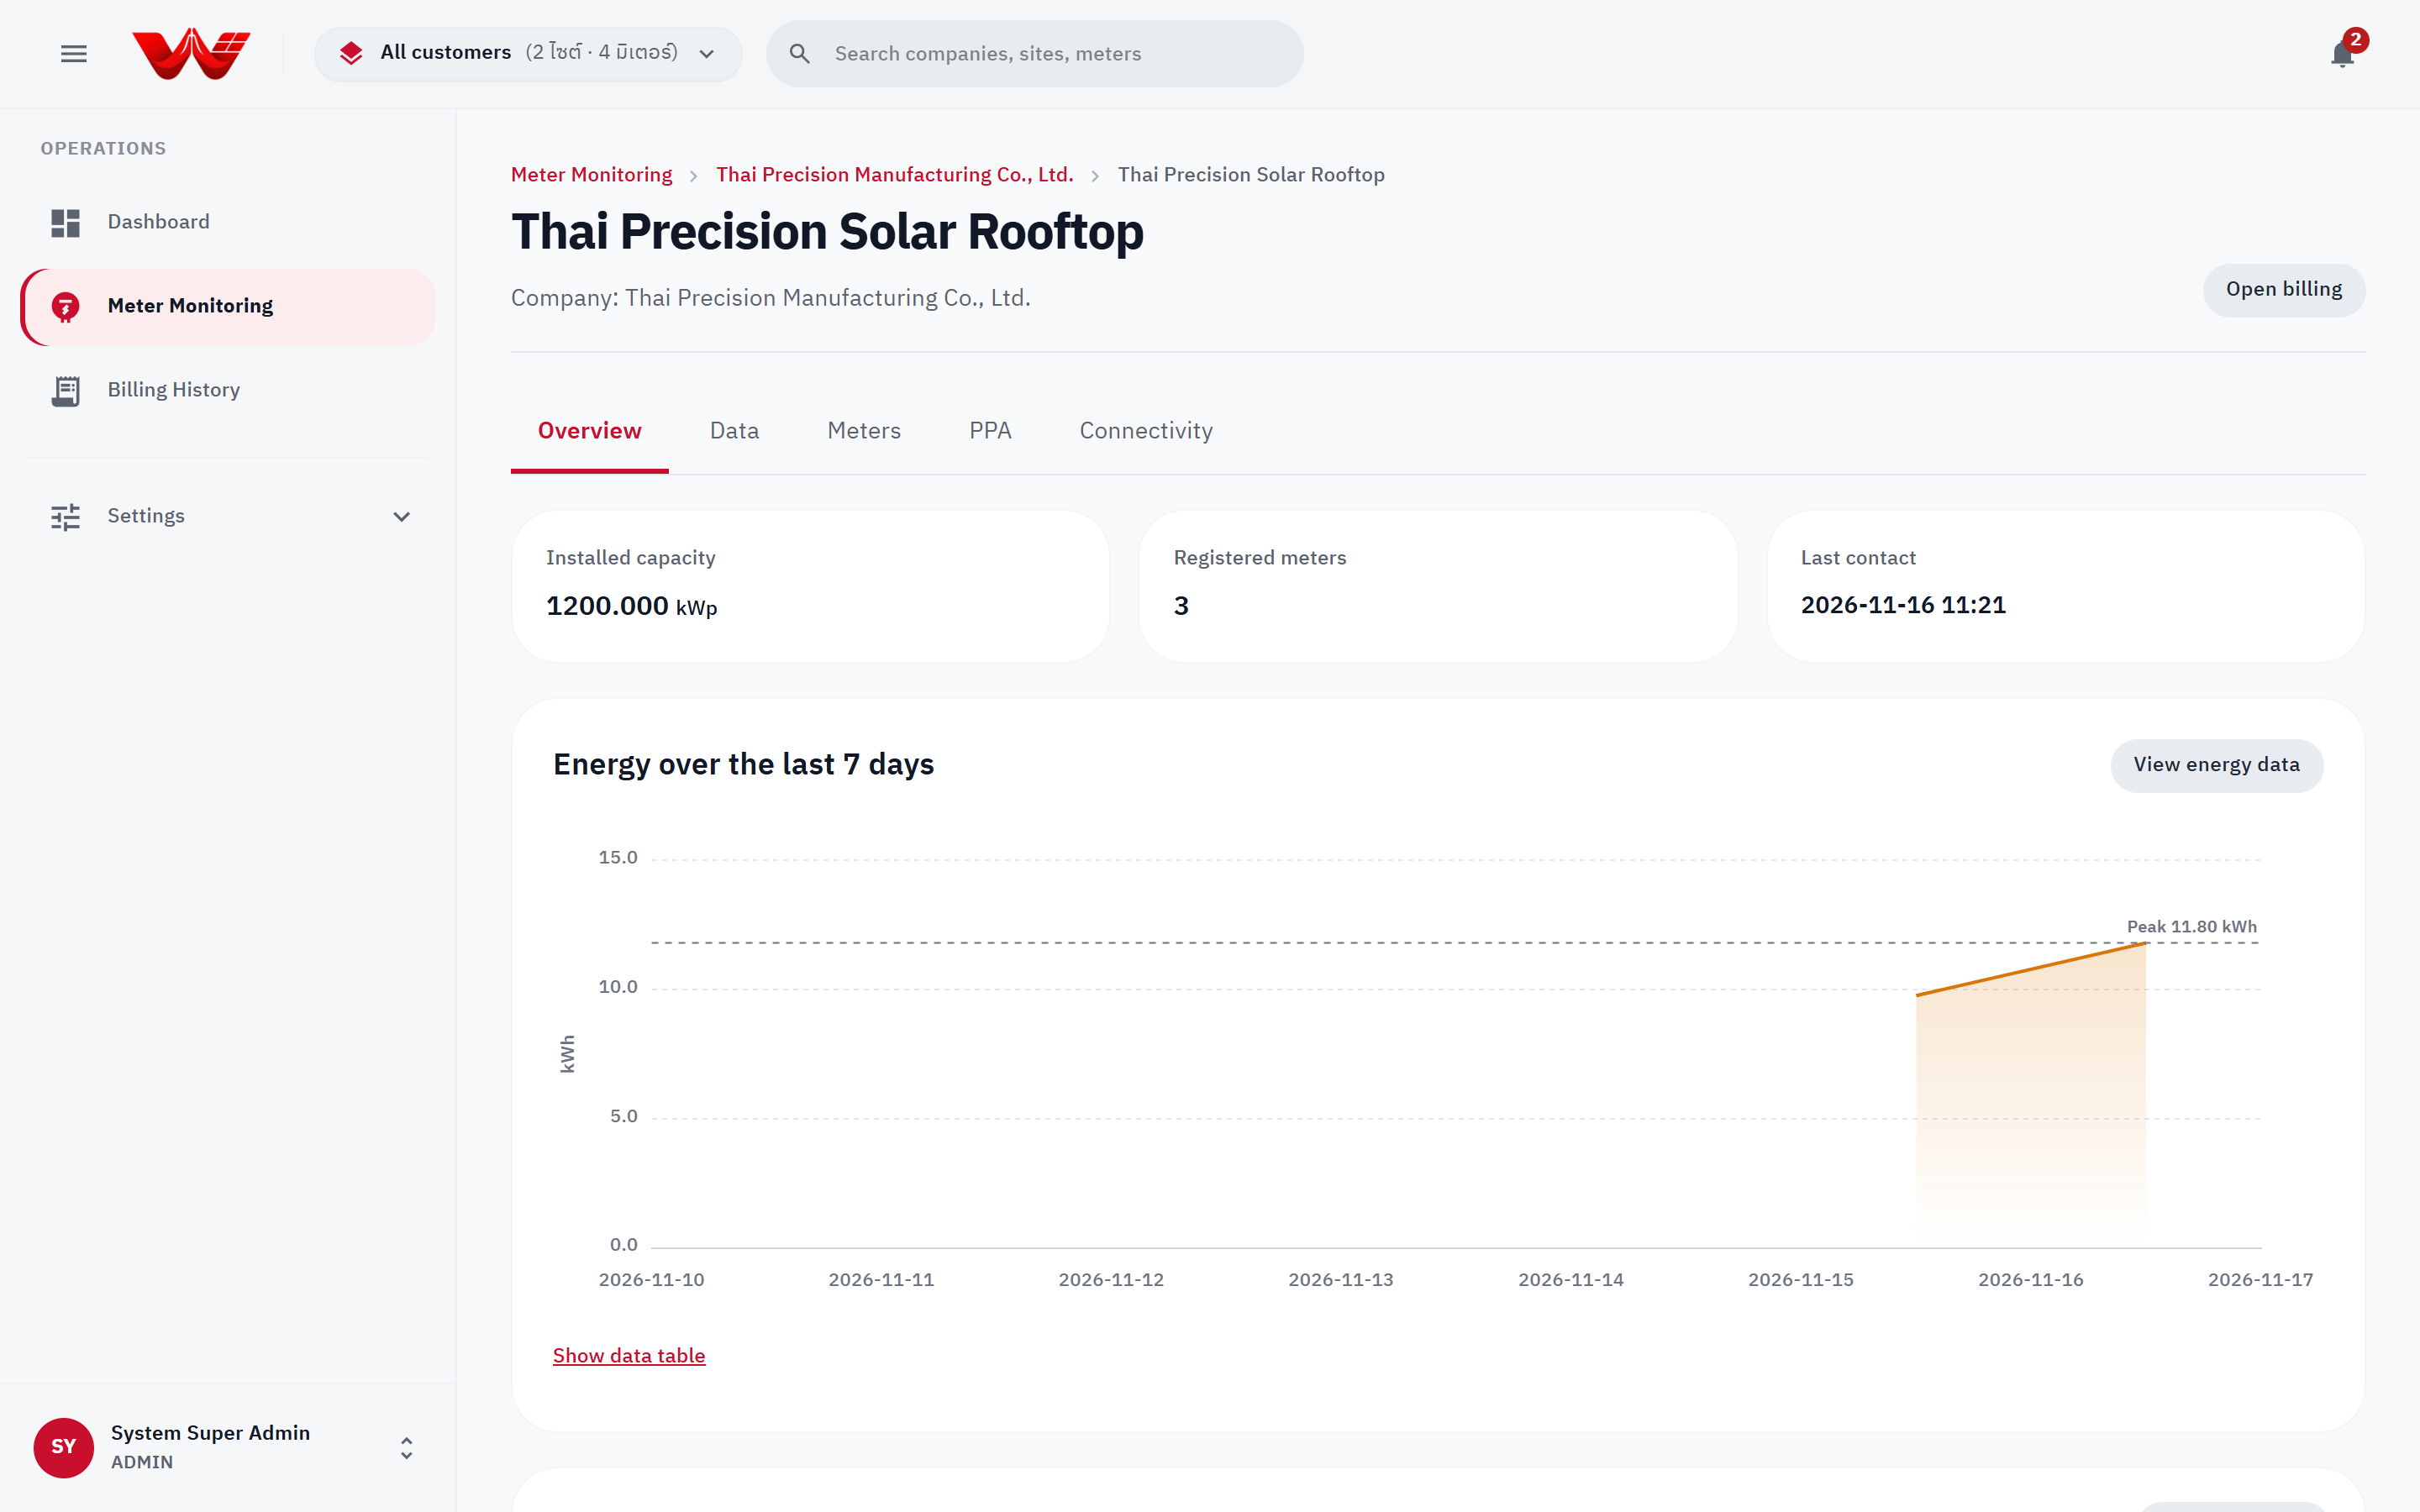 Figure 3: Site overview displaying capacity, 7-day energy trend, and registered meters.
Meter Detail & Live HES Diagnostics
Click any meter to open its detail view (Energy data / Configuration and Diagnostics):
- Review the top status banner explaining why the meter is in its current state and any last HES error.
- Under Commands (requires
meter.command):- Click Test connection: Sends a live probe through HES to verify network reachability, DLMS framing, and the LLS password. Results report latency (
ms) or clear troubleshooting hints:config_error: No LLS password is configured on the HES host.auth_failed: The meter rejected the LLS password configured on HES.Operation canceled / session timeout: Meter was reached but did not answer; checkHDLCvsWRAPPERinterface selection.poll_timeout / connect_failed: Cannot reach the meter; verify IP/port, VPN/network, and meter power.
- Click Read now: Queues an immediate on-demand meter poll.
- Click Test connection: Sends a live probe through HES to verify network reachability, DLMS framing, and the LLS password. Results report latency (
- Inspect Latest reading (
kW, cumulativekWh,PF,Voltage,Current), HES communication details, Meter configuration (flags warnings ifCT × VT ≠ Multiplieror if Reading side isUNKNOWN), and Recent HES events.
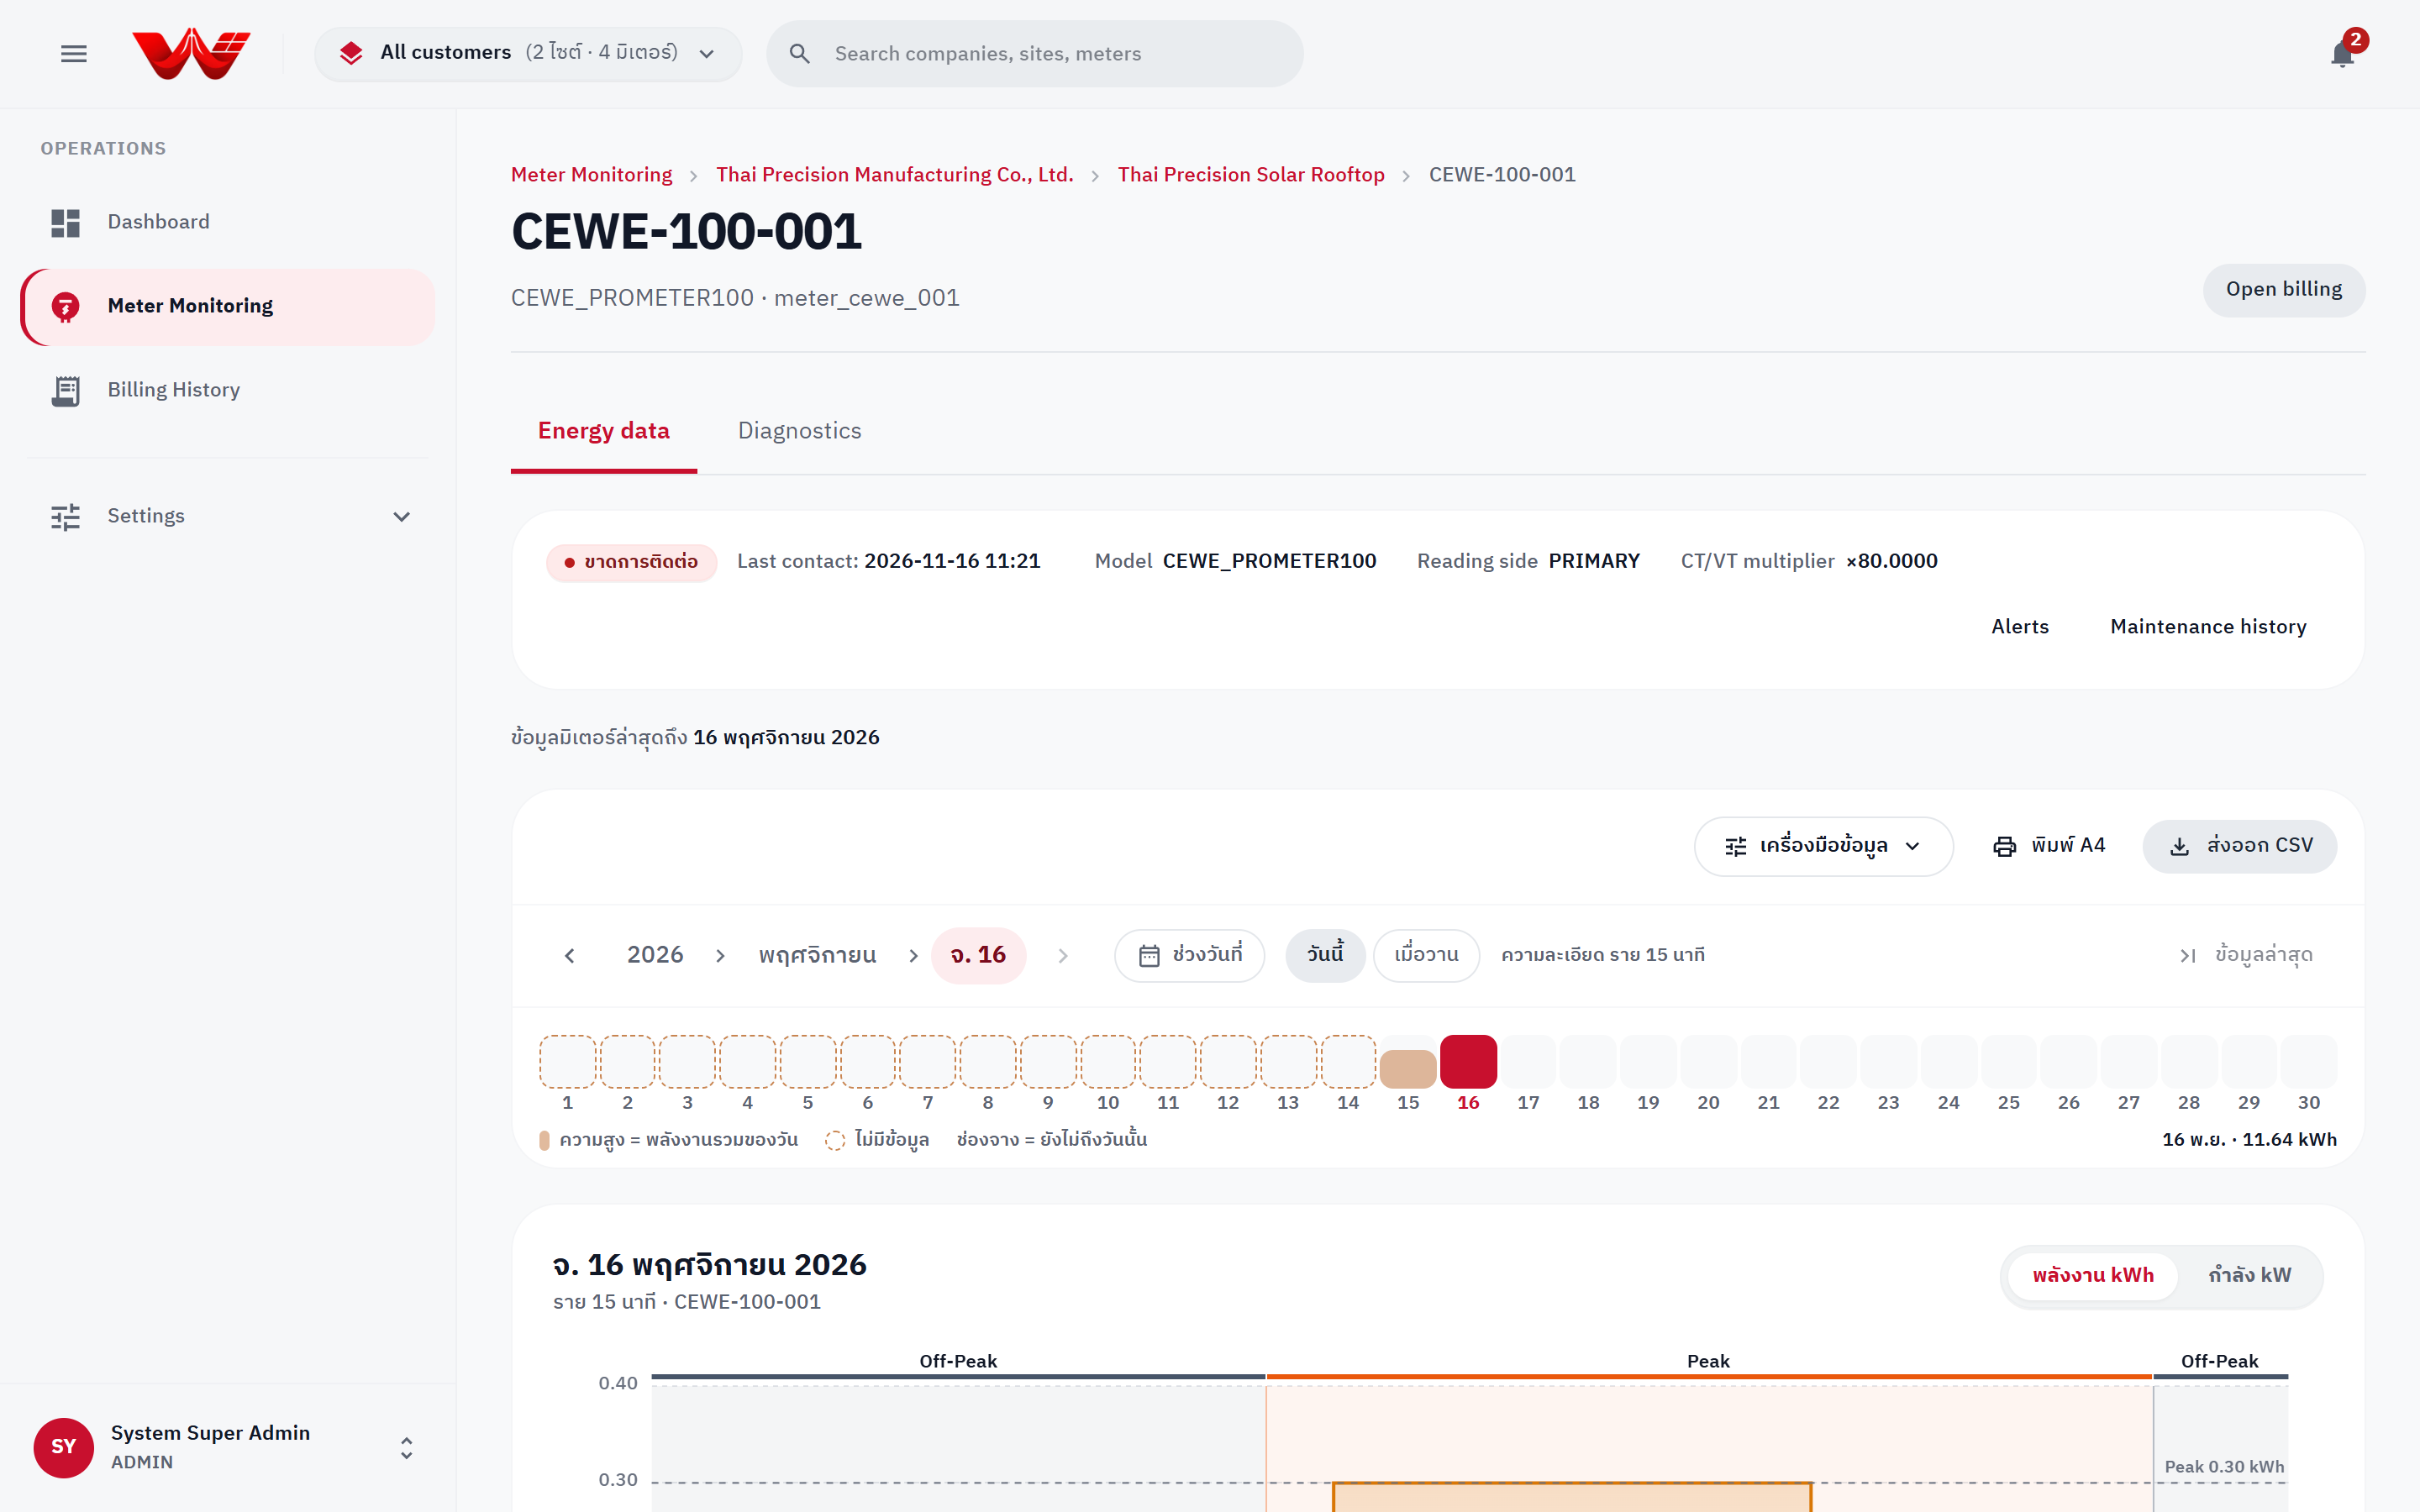 Figure 4: Meter diagnostics view showing live probe commands, latest readings, HES comms, and CT/VT configuration check.
3. Mid-Cycle Meter Replacement (Replace Meter, SOW §79)
When replacing a physical meter on site (due to failure or PEA statutory calibration rotation), never delete the old meter. Use Replace so historical readings stay intact and billing never double-counts energy:
- Open the site under Settings > Meters (requires
meter.write). - Click Replace on the active meter being retired.
- Set the Effective swap date and time to match the physical swap time (
activeTois recorded at this instant). - Choose an inactive Replacement meter in this site (or select retire-only and register the replacement meter afterwards).
- Enter the Reason for replacement (stored in maintenance and audit logs) and click Confirm replacement.
Activate Replacement Meters Separately in HES
Swapping does not automatically activate the replacement meter in HES. After confirming the swap, click Activate in HES on the warning banner (or the replacement meter row) and type its serial/ID to start scheduled polling. Also note that swaps cannot be backdated into months locked by CHECKED or APPROVED invoices.
4. Exploring 15-Minute Telemetry (View Data / Analytics)
Open View Data / Analytics at /view-data (or via the Data tab inside any Site or Meter). All timestamps and calendar boundaries use Asia/Bangkok (UTC+7).
Navigating the Time Zoom Ladder
- Ladder breadcrumb: Switch levels directly from the top bar:
- Year (e.g.,
2026): Monthly bars (click any bar to drill into that month). - Month (e.g.,
November): Daily bars (click any bar to drill into that day's 15-minute intervals). - Day (e.g.,
Mon 16): 15-minute curve (00:00–24:00) with an interactive monthly Day Strip above the chart showing daily energy bars and dashed missing-day indicators. - Date range: Select custom dates or presets (Last 7 days, Last 30 days, This month, Last month) and choose resolution (15 min up to 7 days, Hourly up to 14 days, Daily up to 366 days, Monthly).
- Year (e.g.,
- Quick jumps: Use
</>step arrows, Today, Yesterday, or Latest data to jump straight to the most recent day with meter readings. - Metric toggle: Switch between Energy kWh and Power kW / Peak kW.
Reading the Chart, Markers & Data Table
- TOU rate bands: Background shading indicates Peak (Mon–Fri
09:00–22:00), Off-Peak (Mon–Fri22:00–09:00), and Holiday (weekends & public holidays). - Waiting slots: Hatched bars/rows indicate the interval's scheduled HES read window has not elapsed yet; the view refreshes automatically.
- Missing intervals: Highlighted warning rows summarize consecutive missing slots. WattDee never fabricates
0for missing meter intervals. - Quality markers:
Estimated(interpolated/derived share across a communication gap) andUnder review(meter event flag raised) badges appear on intervals, with source details on hover for roles holdingtelemetry.quality.read. - Site split & phase detail: Multi-meter site views include a per-meter share breakdown; selecting a single meter also displays PF, Voltage (V L1–L3), and Current (A L1–L3) columns when reported.
- Export: Click Export CSV (UTF-8 with BOM for clean Thai characters in Excel) or Print A4.
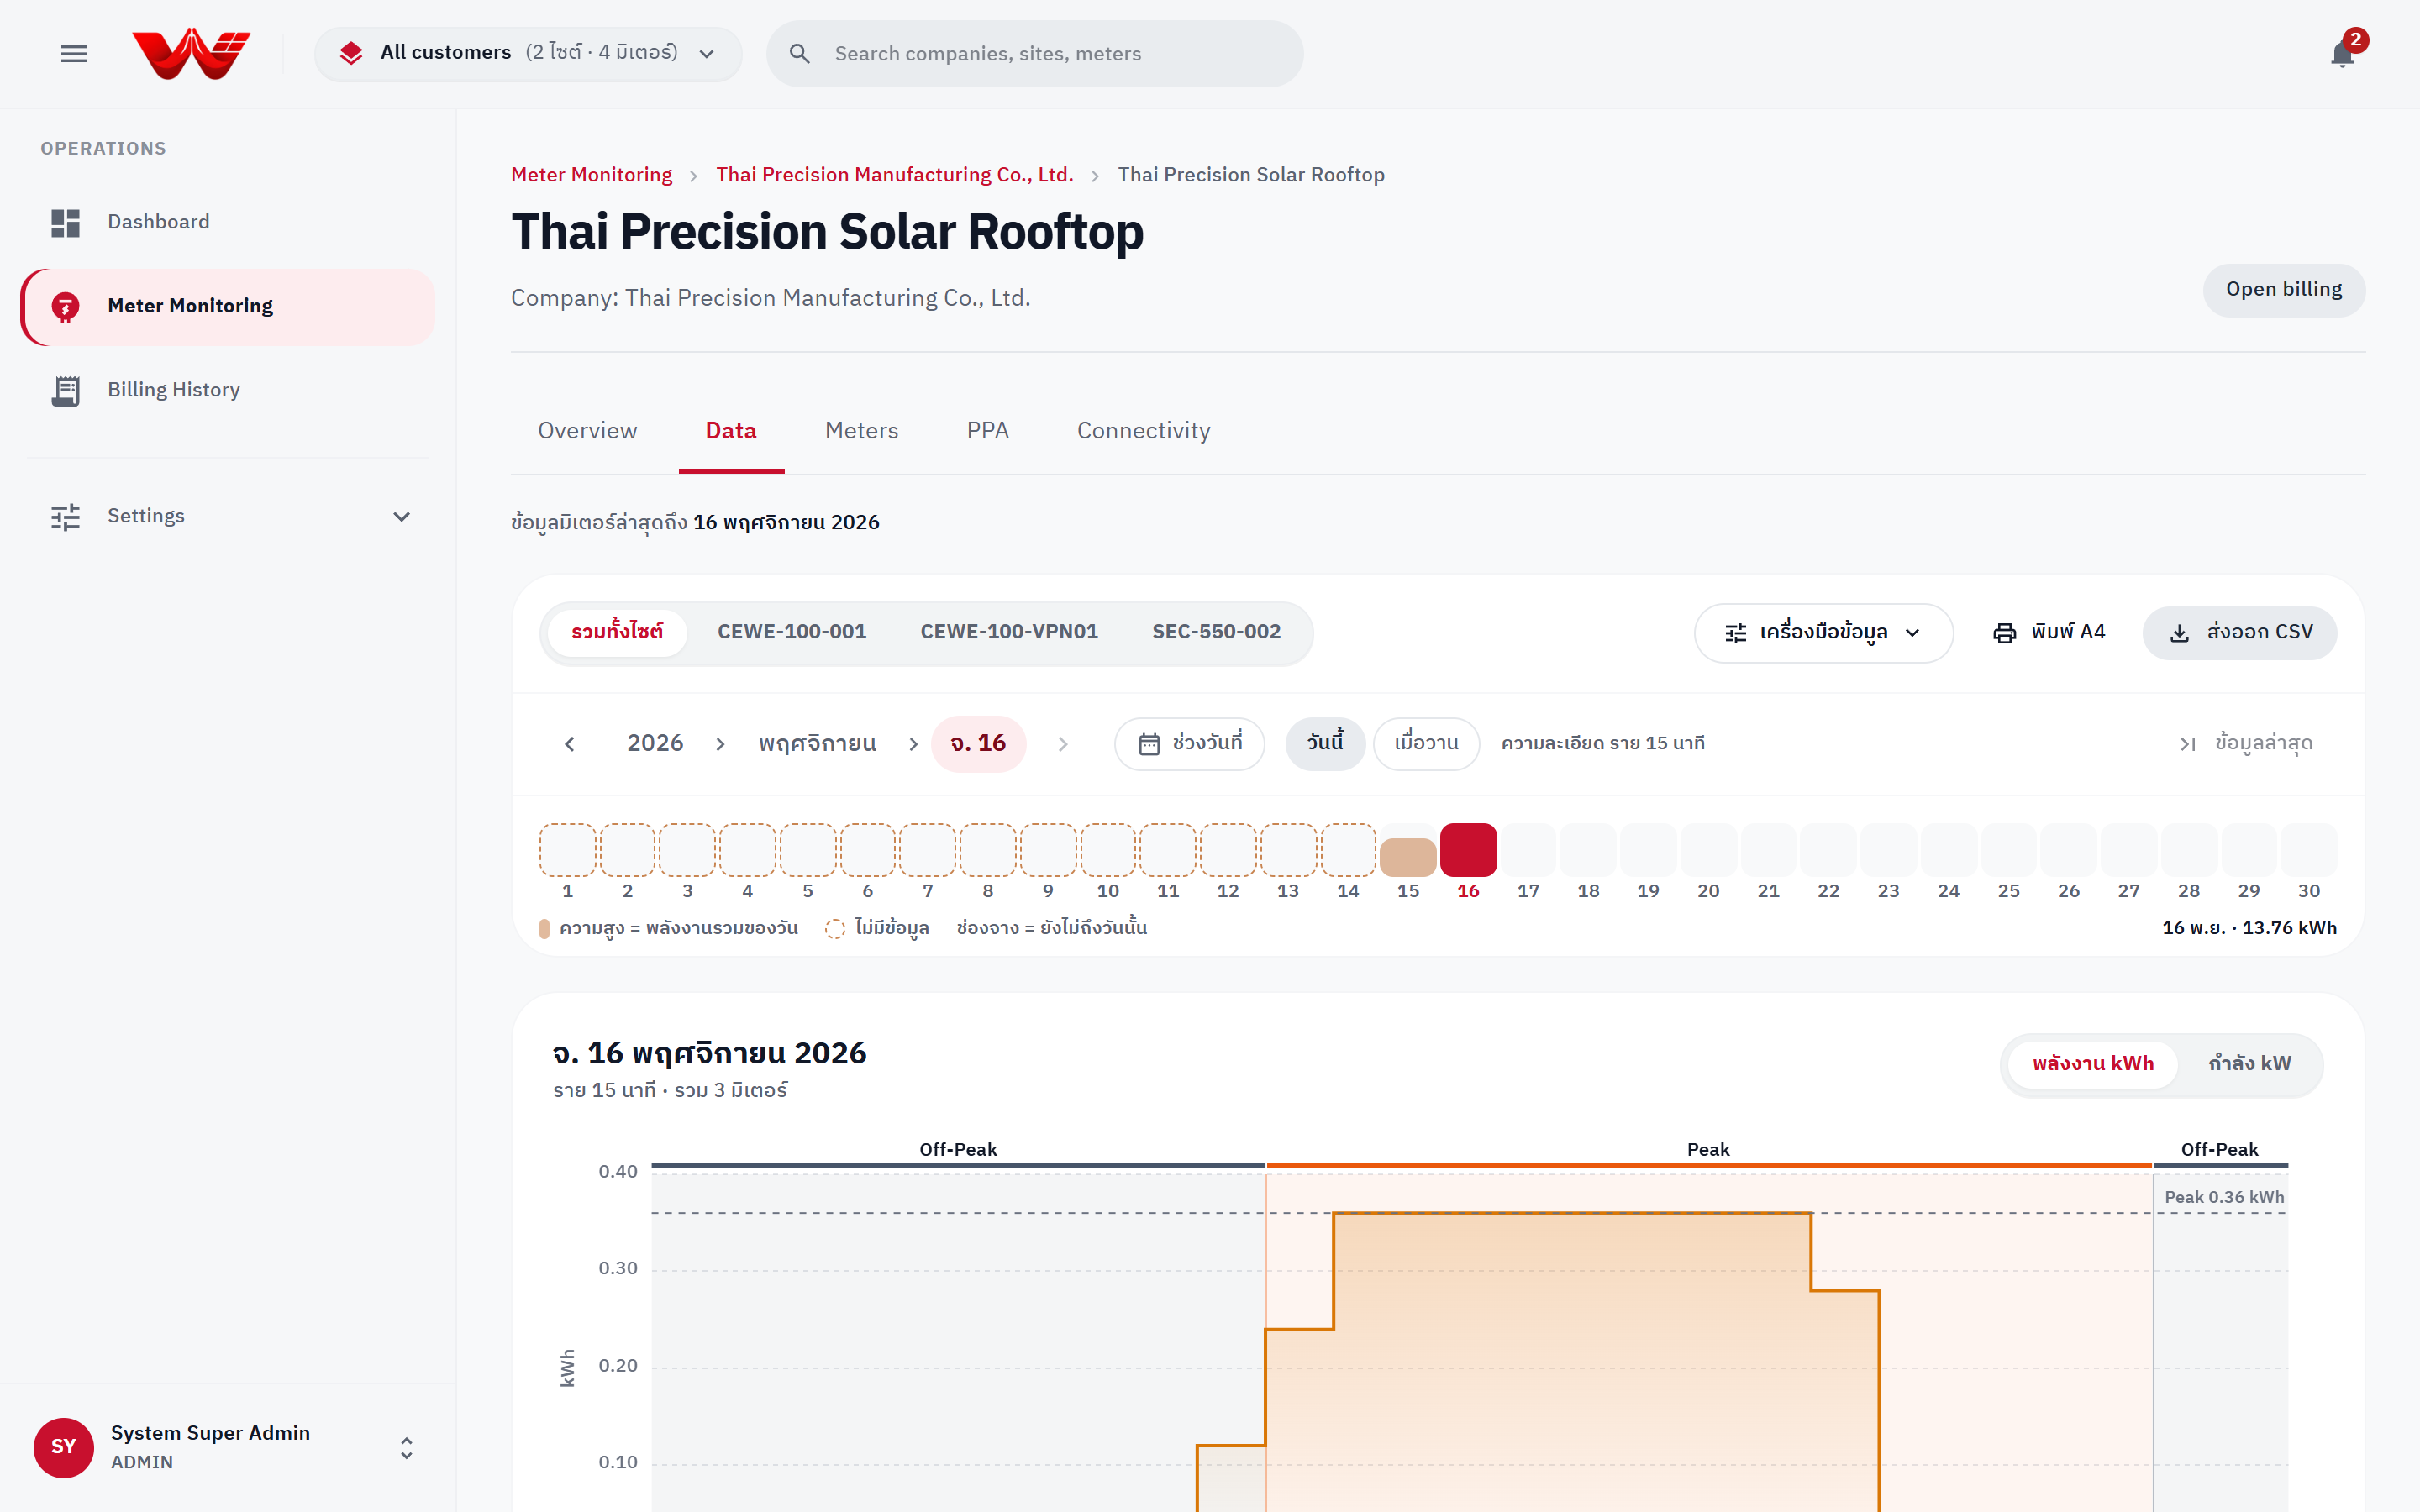 Figure 5: View Data telemetry explorer with Zoom Ladder, Day Strip, TOU load curve, summary tiles, and 15-minute table.
5. Data Tools: Quality & VEE Repair, Backfill & Period Compare
Click the Data Tools dropdown in the top-right toolbar of View Data to access three specialized panels:
1) Data Quality & VEE Repair
Everyone can inspect completeness metrics; repair actions require telemetry.sync (Admin or O&M Engineer):
- Completeness summary: Shows overall completeness (
%), observed vs. expected 15-minute slots, and source breakdown (Auto meter reads, Auto-estimated, Manual / CSV import). - Auto-fill missing intervals:
- Select the meter and estimation method:
- LINEAR: Linear interpolation between the previous and next known points (recommended for short gaps).
- ROLLING_AVG: Historical rolling average for the same 15-minute slot from the preceding 7 days.
- Click Run auto-fill (fills empty slots only, never overwrites actual meter reads, and labels rows as
Estimated, max 31 days per run).
- Select the meter and estimation method:
- Manual reading edit:
- Select the meter and a 15-minute aligned timestamp (
:00,:15,:30, or:45). - Enter Energy (kWh), Average power (kW) (leave
0to auto-calculatekWh × 4), Reactive power (kVAR), and a Reason (minimum 3 characters). - Click Save changes (all previous/new values and actors are logged in the meter's edit history).
- Select the meter and a 15-minute aligned timestamp (
- CSV import:
- Choose the target meter and specify whether values are Already net kWh or Raw meter values (apply CT/VT multiplier automatically).
- Upload a
.csvfile or paste CSV lines with headertimestamp,active_energy_kwh,active_power_kw,reactive_power_kvar(up to 5,000 rows per batch), enter a reason, and click Import.
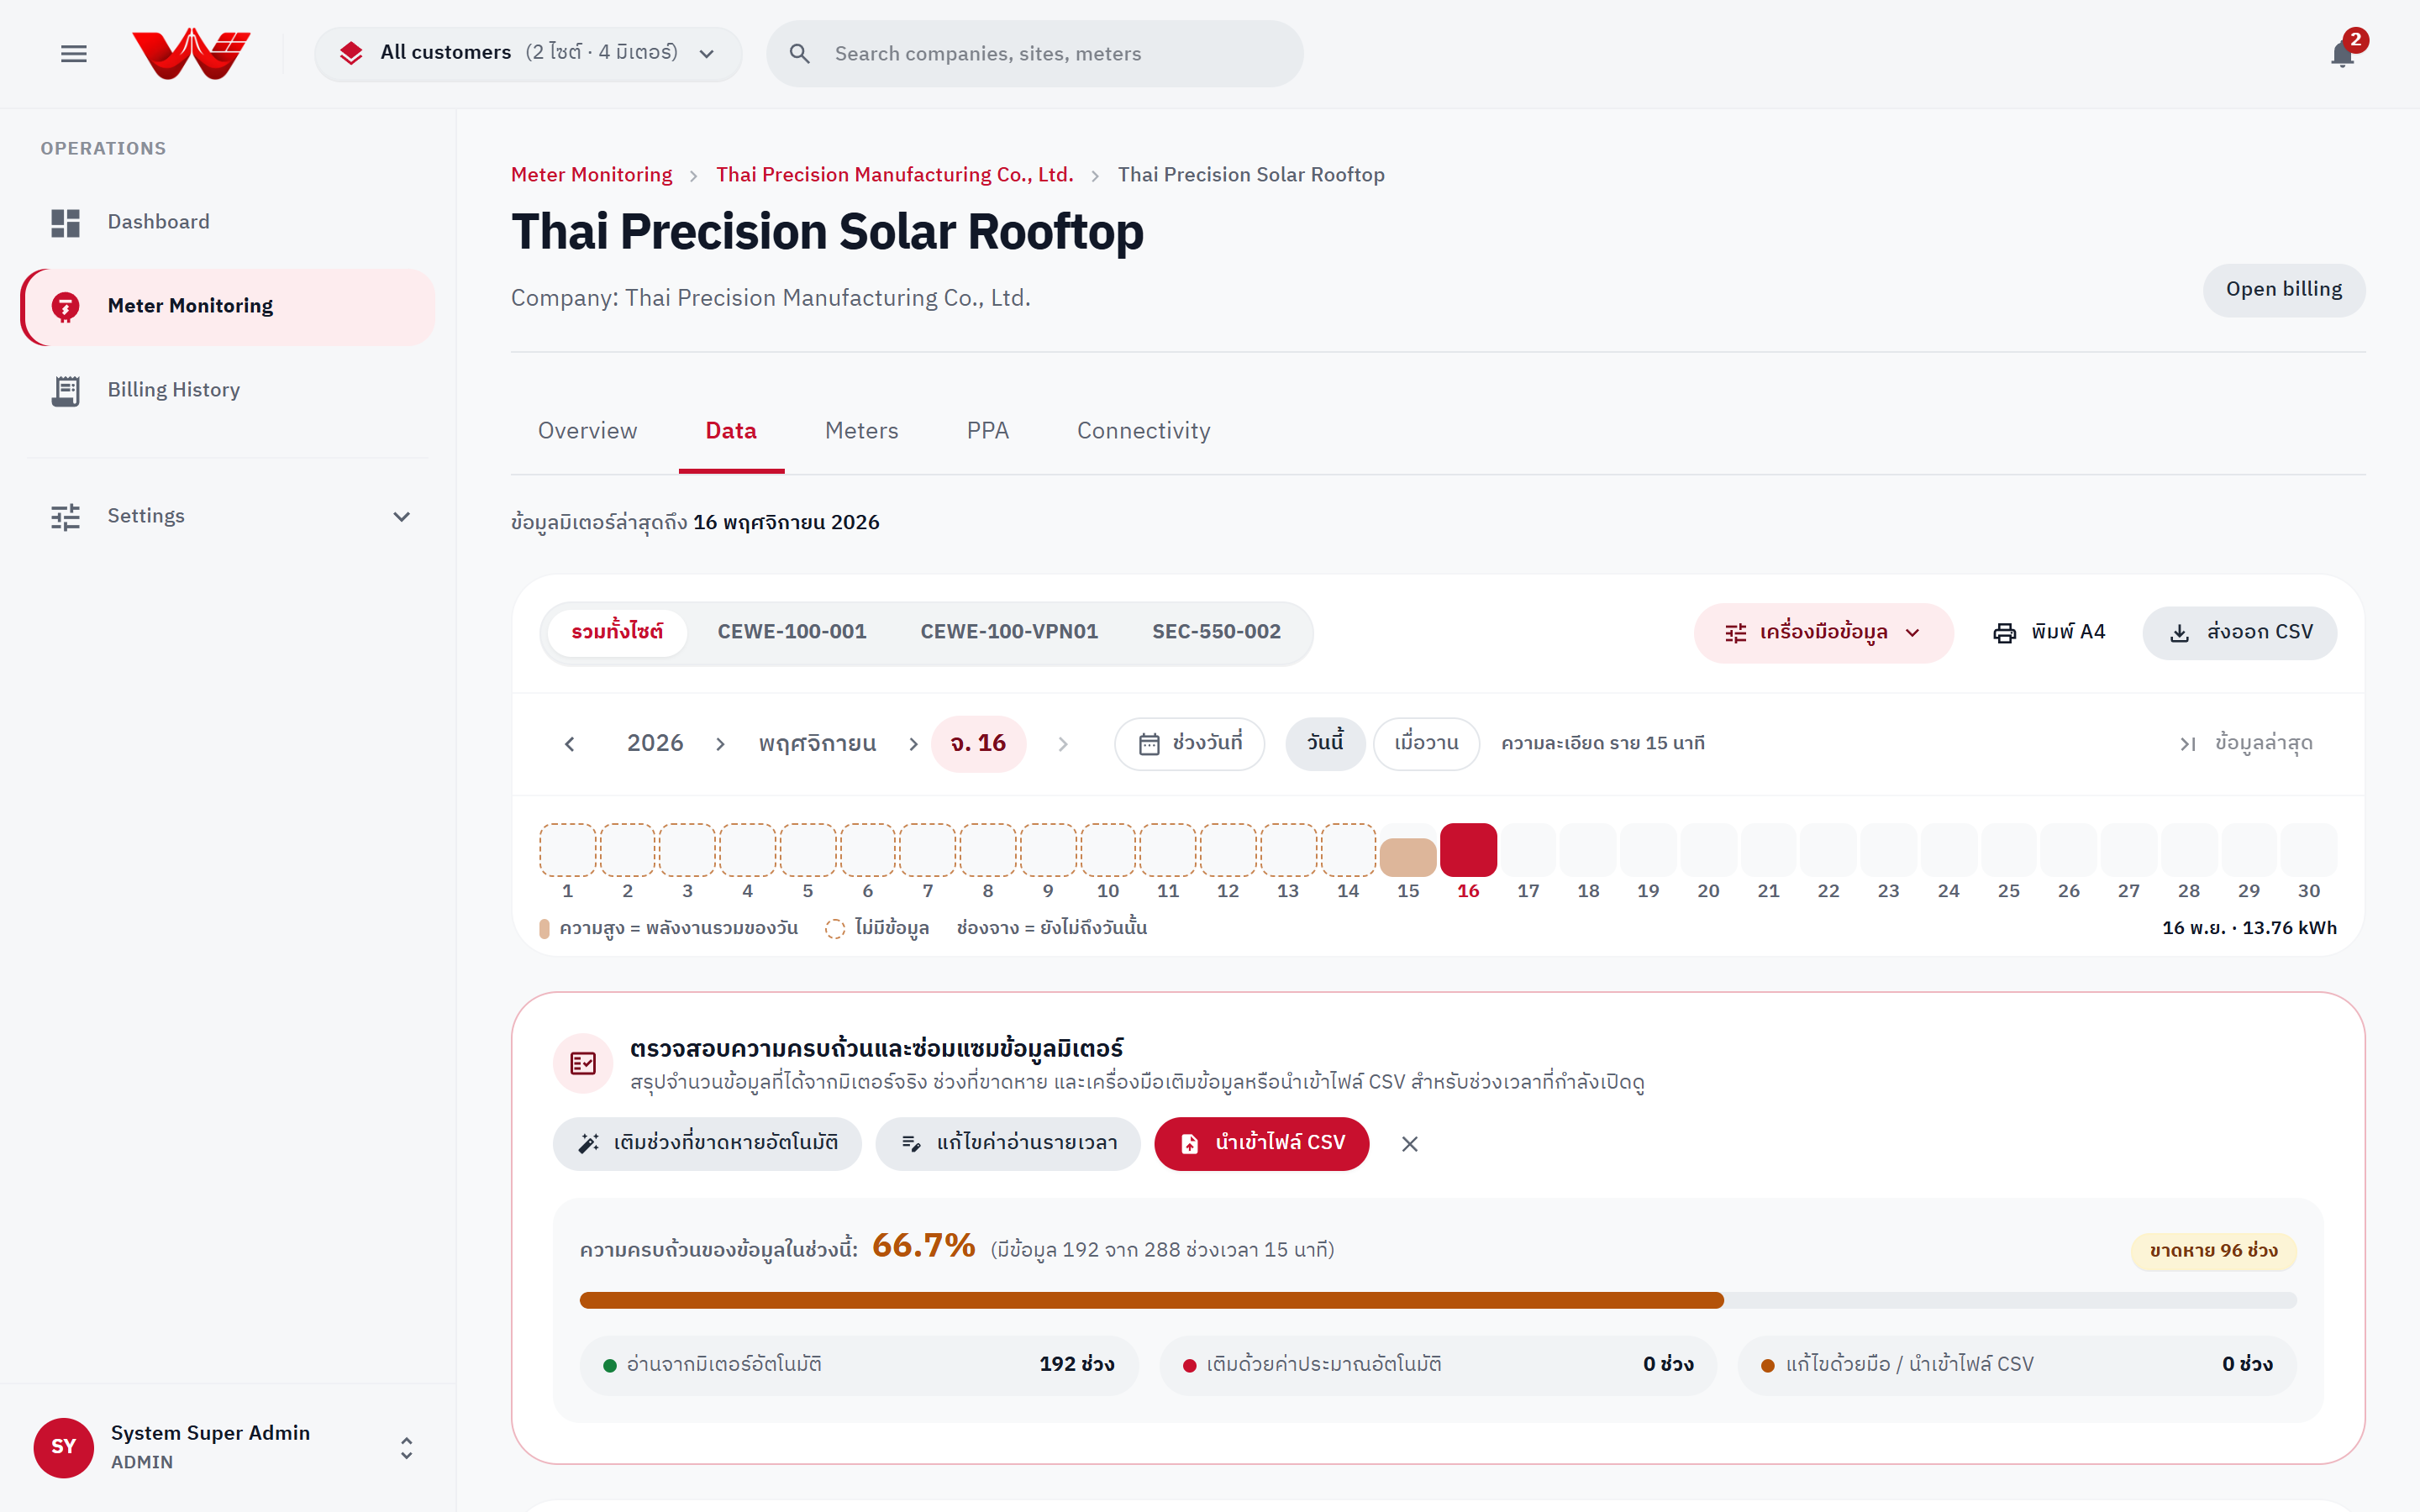 Figure 6: Data Quality & VEE panel showing completeness bar, source breakdown, and Auto-fill / Manual Edit / CSV Import actions.
Billing Period Lock Protection
Auto-fill estimation, manual edits, and CSV imports are blocked (409) for any month that has a CHECKED or APPROVED invoice. Ask Accounting to return or void the invoice before repairing telemetry in that period.
2) Backfill from Meter (meter.command)
Requests HES to re-read the 15-minute load profile (DLMS Profile Generic 1.0.99.1.0.255) directly from the physical meter's memory:
- Open Data Tools > Backfill from meter.
- Select one or more meters and a Bangkok From – To date range (maximum 31 days per request, cannot include future dates).
- Review the estimated slot count and click Send request.
- HES processes the span in 7-day chunks and reports live progress (
Sending→Queued→Reading→Done/Failed). You can close the drawer while commands finish in the background.
Backfill Overwrites & Draft Invoices
Recovered readings overwrite existing values in the requested span. If an open DRAFT invoice covers that month, it is flagged stale so Accounting knows to recalculate; months locked by CHECKED/APPROVED invoices hold changes safely in late-interval tracking.
3) Compare Periods
- Open Data Tools > Compare periods.
- Pick a quick preset (This month vs Last month, Last 7 days vs Prior 7 days, This year vs Last year) or choose custom Period 1 and Period 2 date ranges.
- Review the Total Energy (kWh) and Peak Demand (kW) delta cards alongside the side-by-side TOU breakdown table (On-Peak, Off-Peak, Holiday).
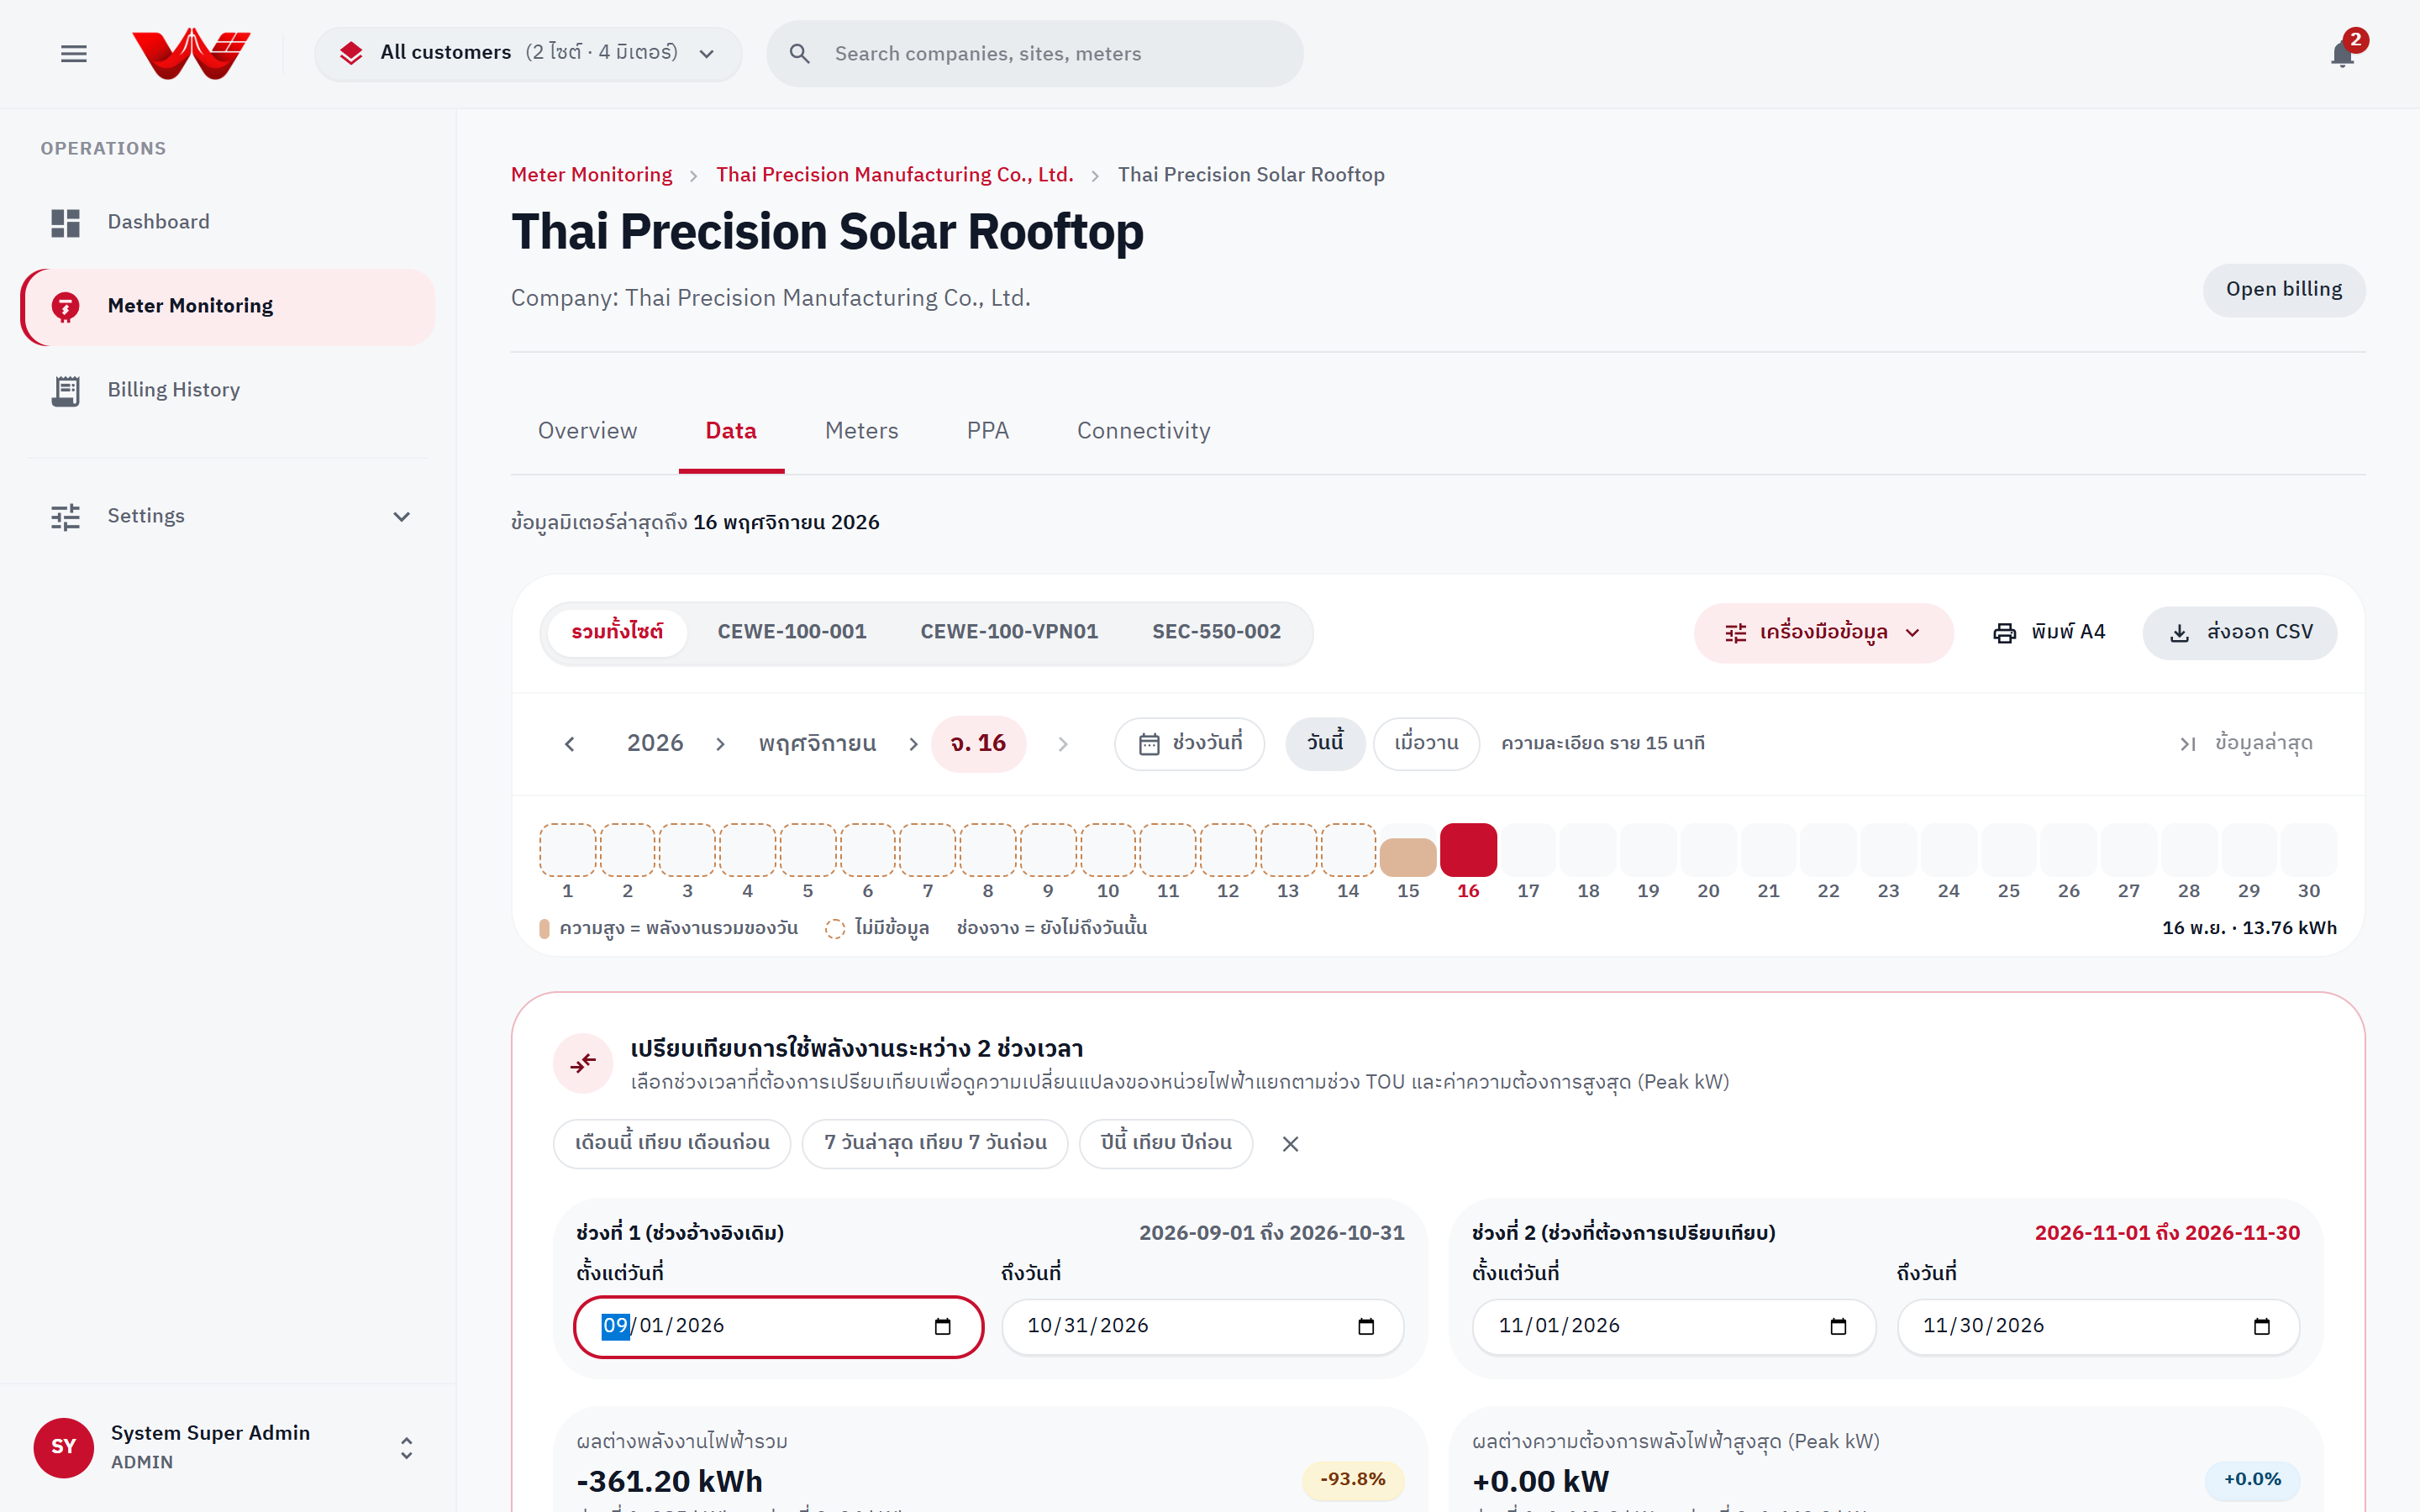 Figure 7: Compare Periods panel showing kWh and Peak kW deltas across two selected date ranges.