---
title: Meter & Telemetry Guide
---
::: warning UAT release
This guide describes the upcoming portal update. Some screens or actions may differ in the current UAT portal.
:::
# Meter Monitoring & Telemetry Guide
**Who is this for:** Central Operations (Platform SERVICE) O&M Engineer (Developer SERVICE) System Operator (OPERATOR) Administrators Customer Off-taker (view only)
**Prerequisites:**
- Sites and meters are registered under a Solar Developer and Customer company.
- Live commands (**Test connection**, **Read now**, **Backfill**) require `meter.command` and an active HES service.
- Telemetry repair (**Auto-fill estimation**, **Manual edit**, **CSV import**) requires `telemetry.sync` (Platform/Developer Admin or Service).
---
## 1. Fleet Meter Monitoring (`Meter Monitoring`)
Open **Meter Monitoring** from the left sidebar to track meter health across your permitted portfolio, sorted **worst-first** so offline and unreporting meters surface immediately.
### Four Top-Level Views
1. **Meters** *(default board)*: Lists every meter (plus sites without meters yet) sorted by severity (`Offline` → `Never reported` → `Not linked to HES` → `No meter` → `Online with alarms` → `Online` → `Switched off`).
- **Status filter chips:** Click **Offline** *(silent > 1 hour, `commLostAt`, or HES verification failed)*, **Not reporting / not linked**, **With alarms**, or **Sites without a meter**.
- **View as switcher:** Aggregate rows by **Developers** *(platform only)*, **Offtakers**, or **Sites / Meters**, plus a customer dropdown and **Search** box (matches site name, offtaker, serial, model, site code like `1-00012`, or `IP:Port`).
2. **Regions:** Interactive province & region cards displaying total kWp, GPS coordinates, and online percentage bars. Click any province card to filter the meter table below.
3. **Maintenance:** Summary counts and filterable log of **Swap**, **Maintenance**, **Calibration**, and **Inspection** events, with CSV export and **Log maintenance** *(requires `meter.write`)*.
4. **Alerts:** Two sub-tabs: **Active alerts** *(acknowledge, snooze, assign, and add notes)* and **Event history** *(filter by `Critical / Warning / Info` and Bangkok date range defaulting to the last 30 days, with CSV export)*.
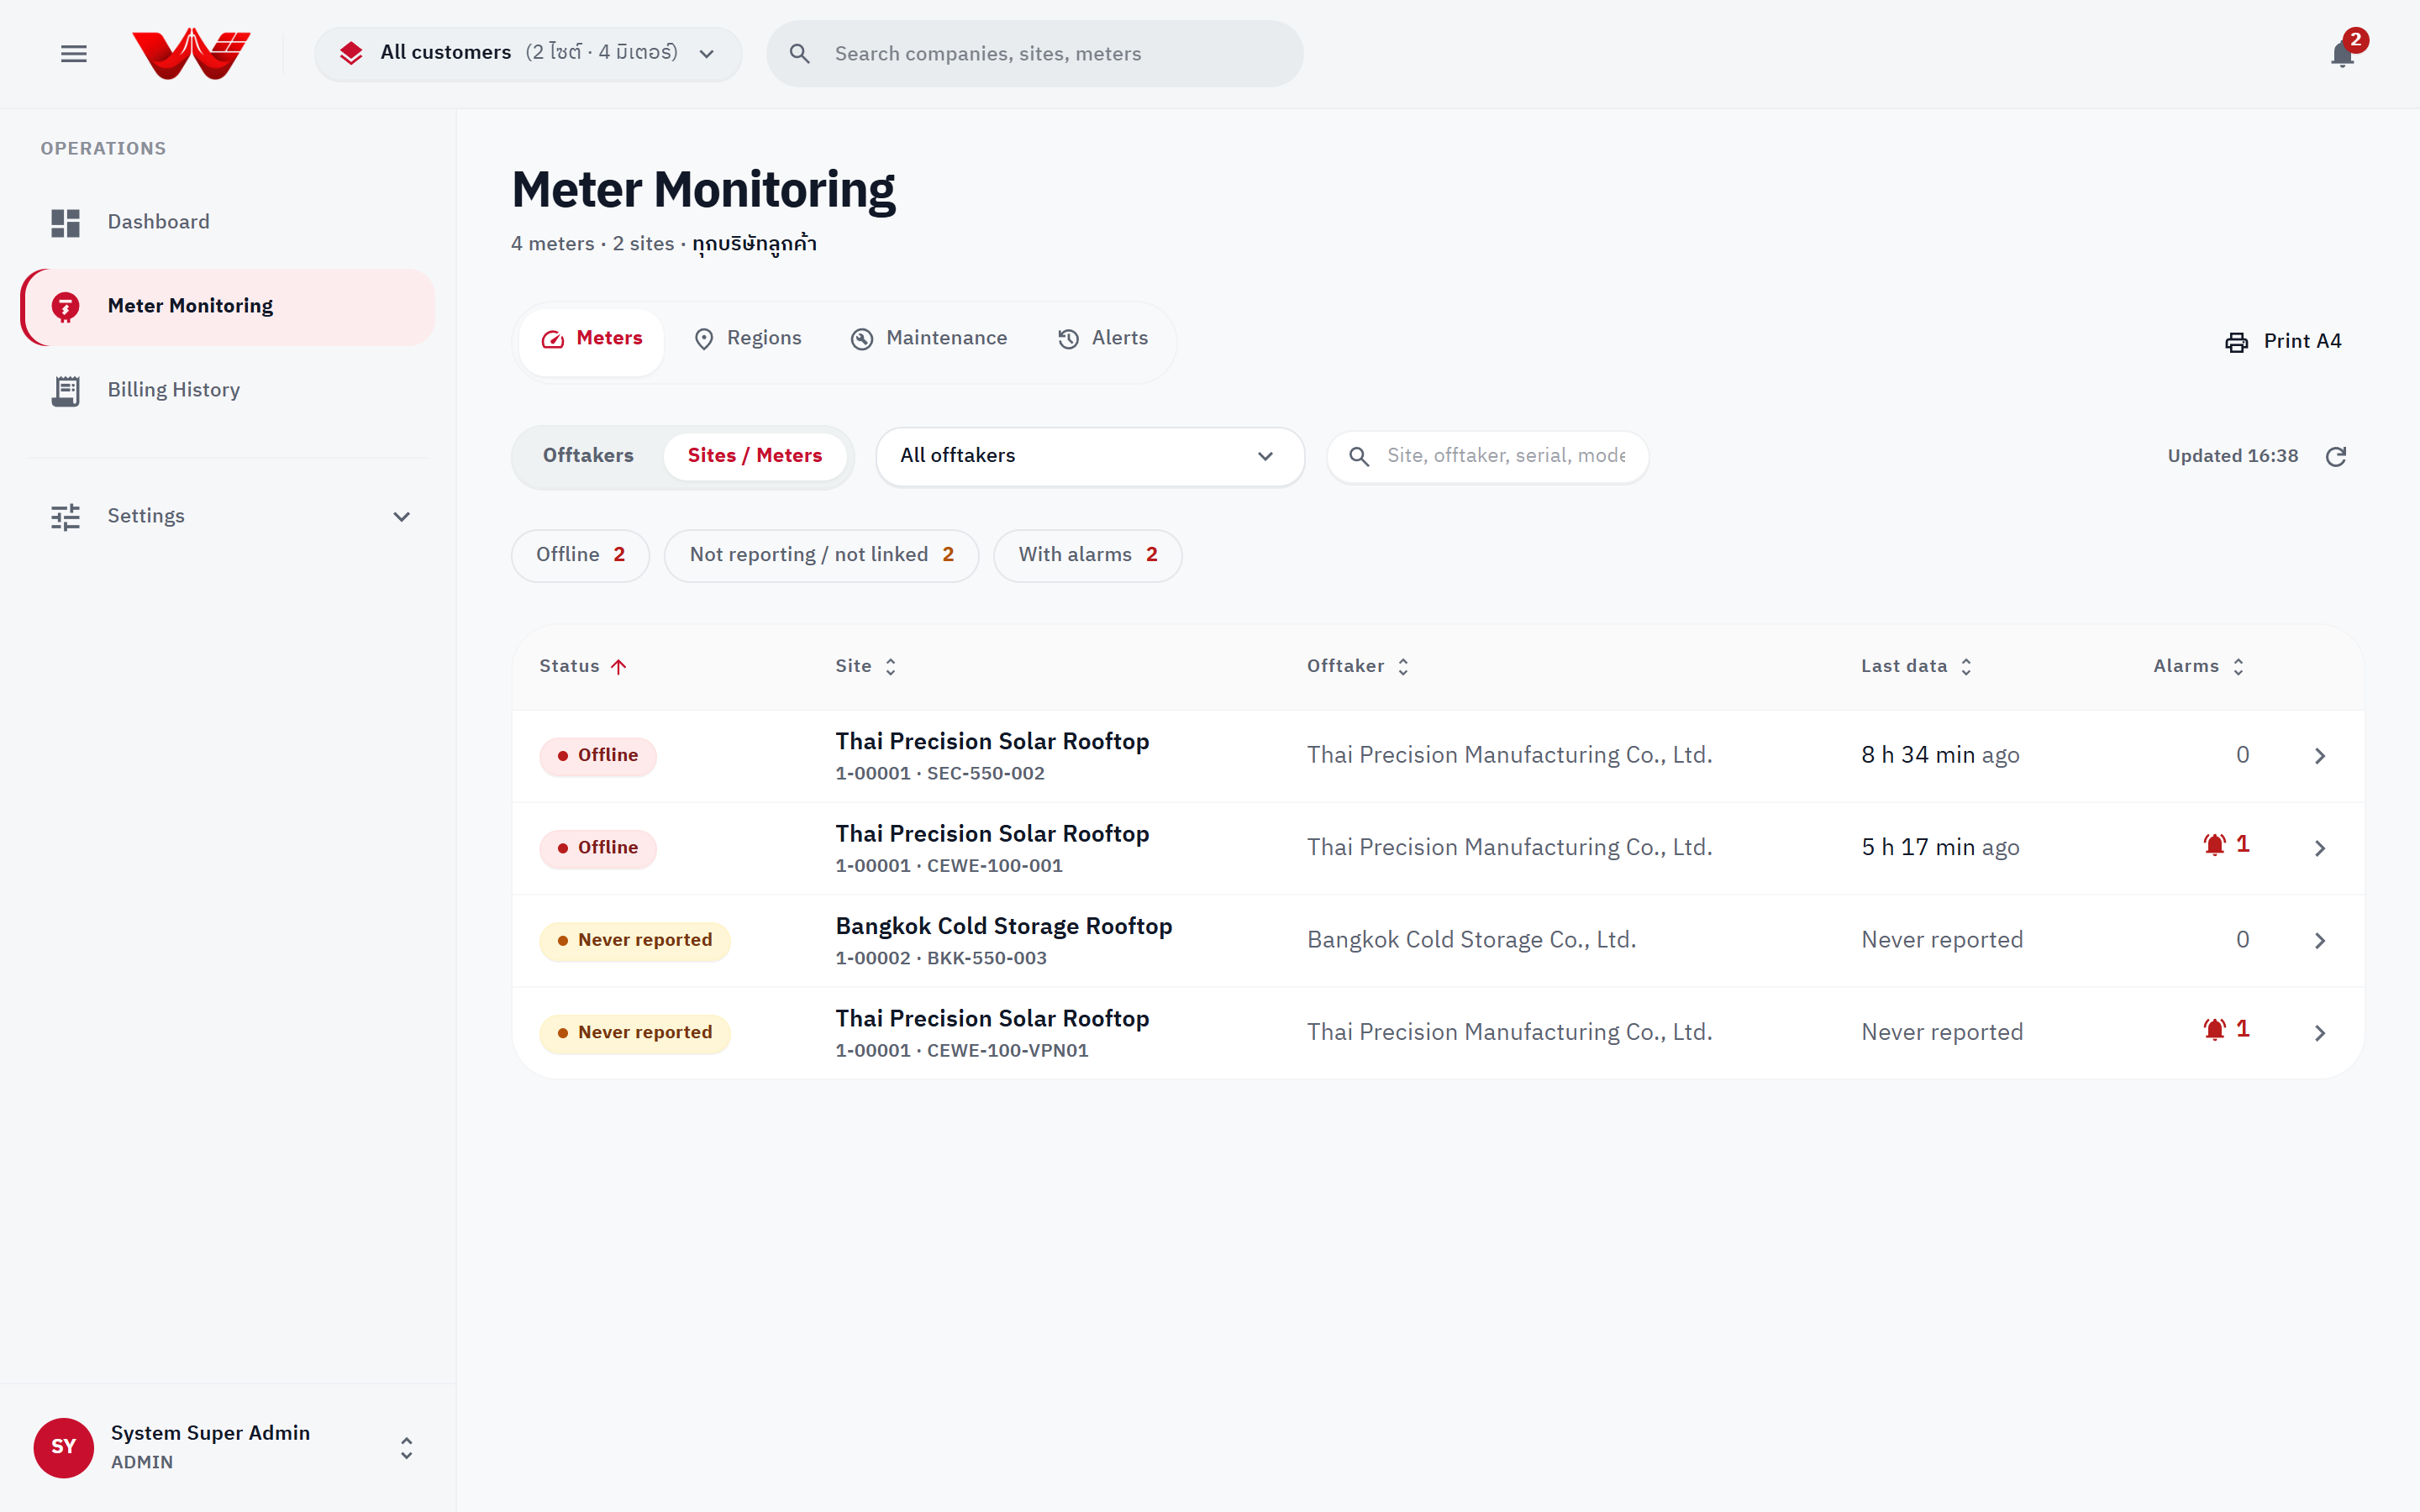
*Figure 1: Meter Monitoring fleet board with view tabs, status filter chips, and worst-first meter table.*
---
## 2. Drill-Down: Company Overview → Site Overview → Meter Detail
### Company Overview
Open any customer or developer company to view:
- **Energy period selector:** `Today`, `Last 7 days`, `This month`, or `Custom` (up to 93 days).
- **4 Summary KPIs:** Energy in selected period (`kWh`), Meters recently contacted (`reporting / active`), Sites needing attention, and Company sites.
- **Needs attention panel:** Direct links to sites missing a PPA, missing active meters, or with silent meters, plus a **Company billing** status summary and exportable site list.
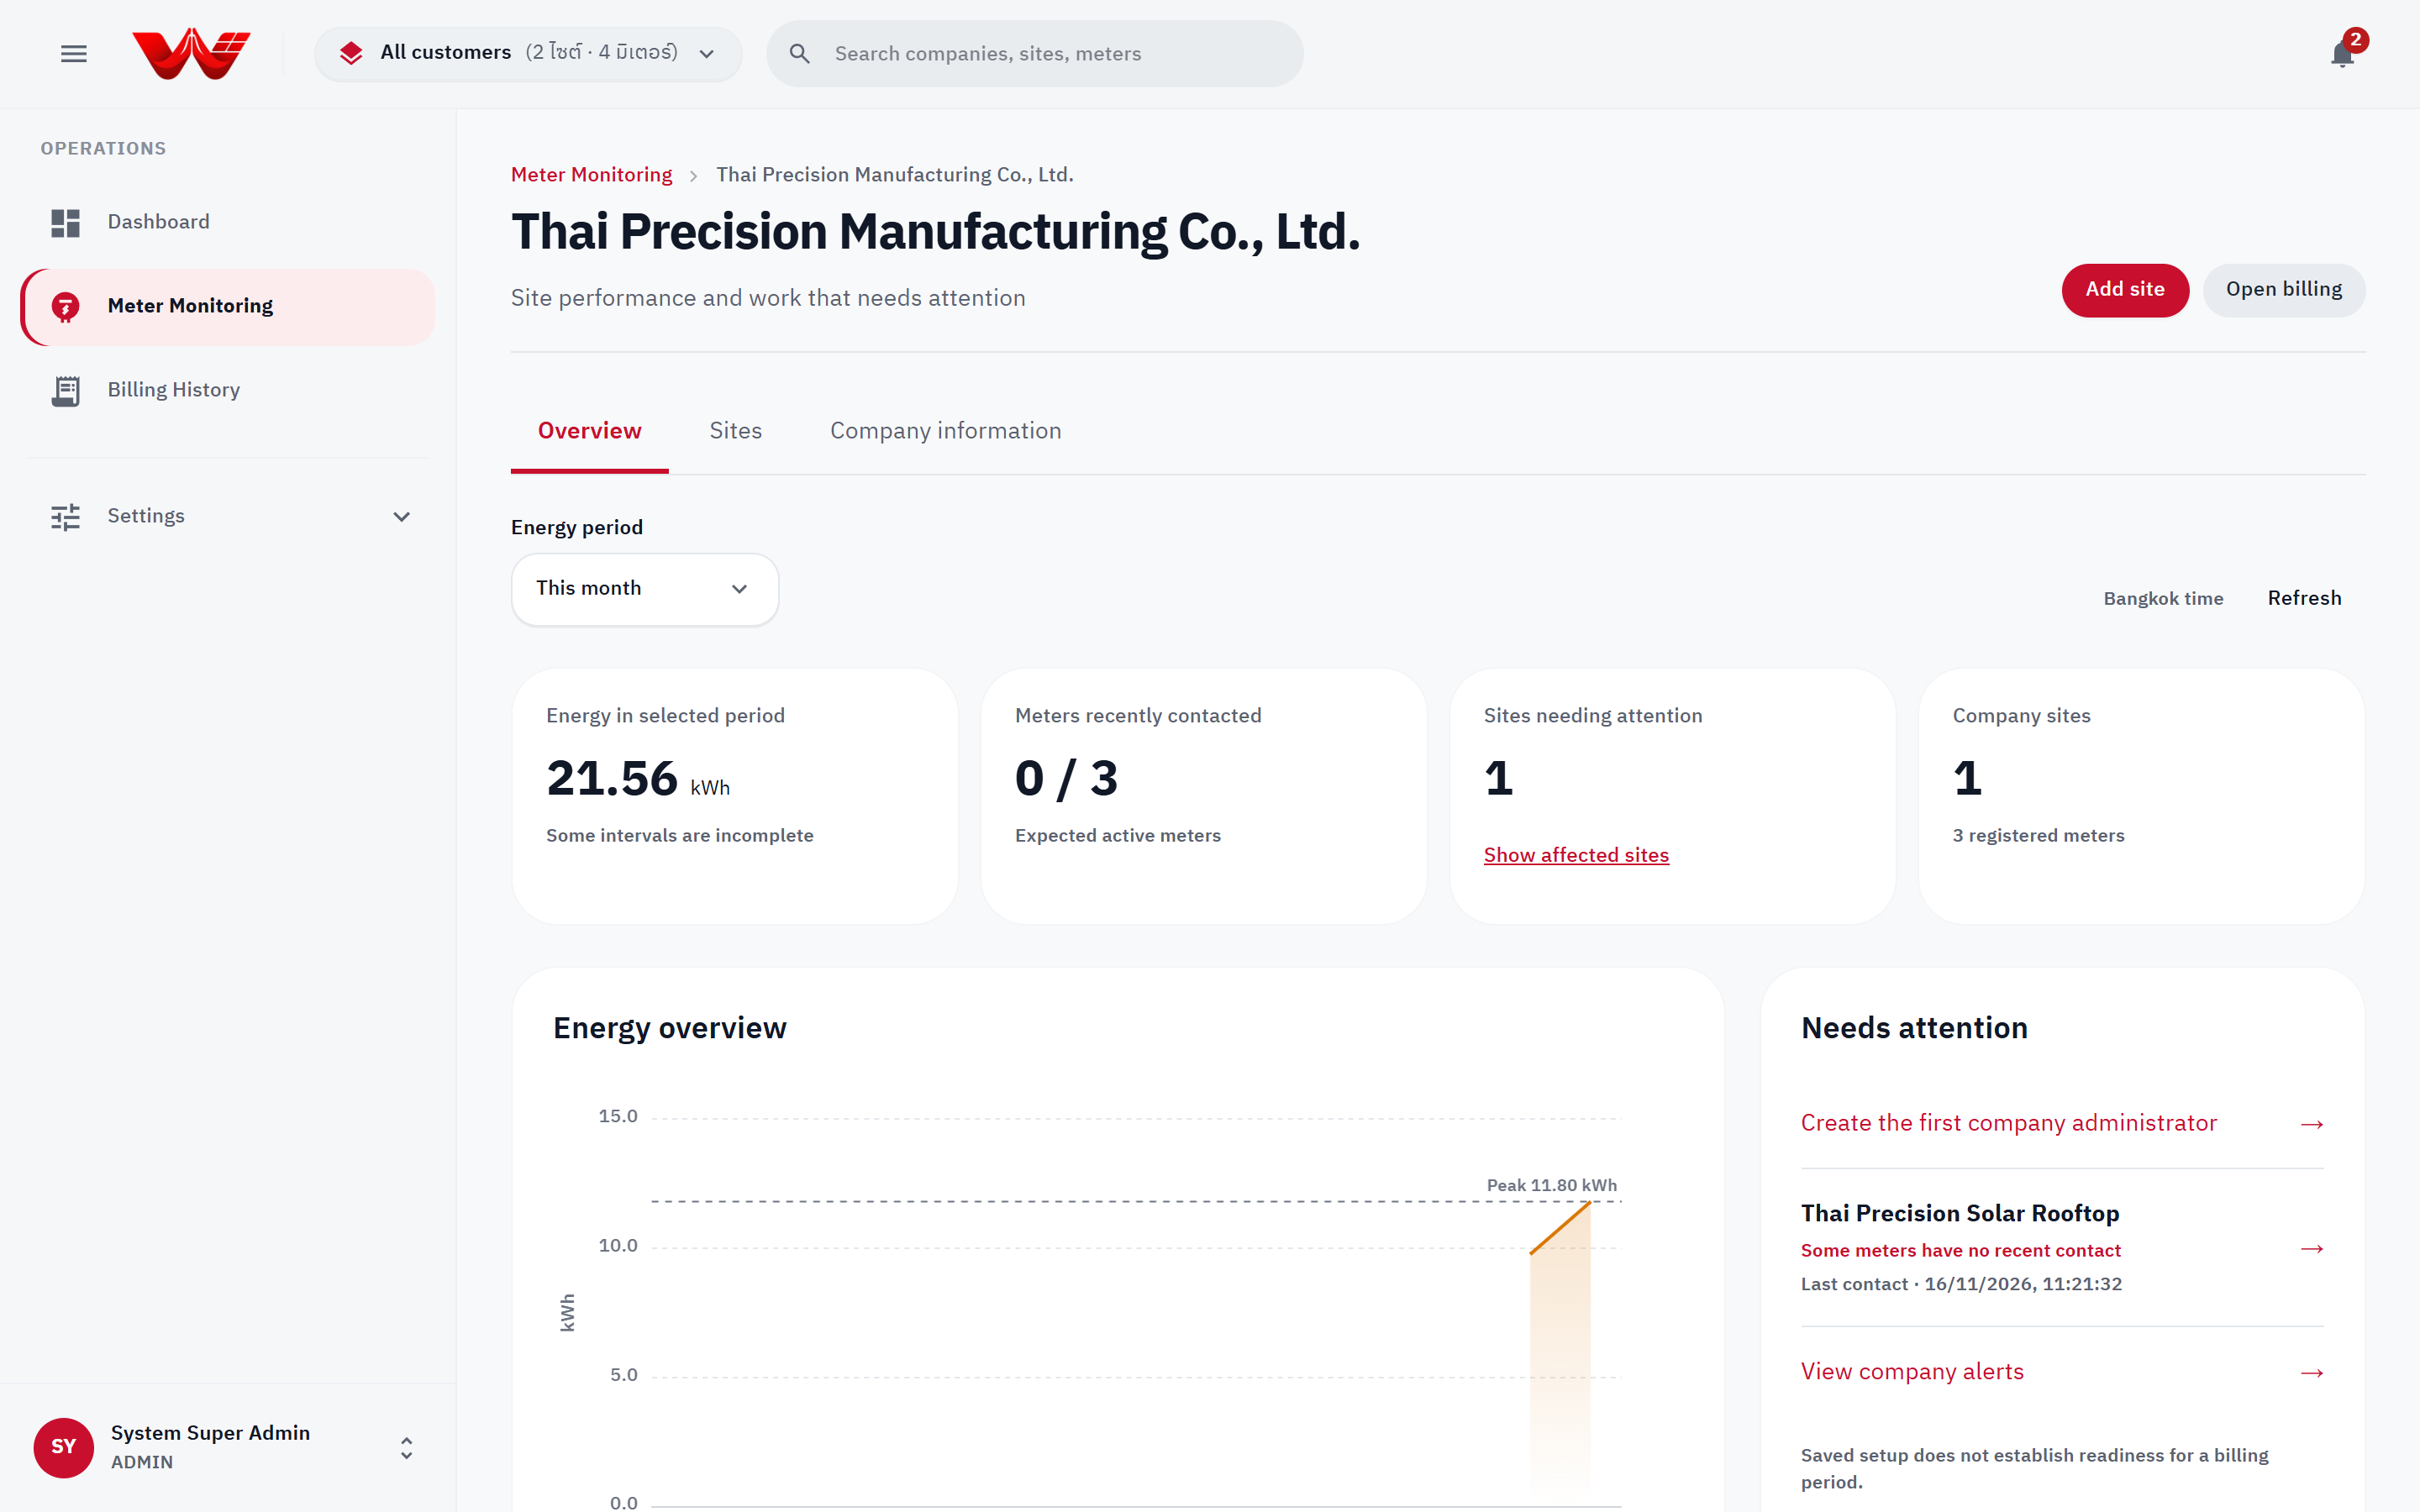
*Figure 2: Company overview showing period energy trend, Needs attention items, billing snapshot, and site table.*
### Site Overview
Click any site to open its workspace tabs:
- **Overview:** Installed capacity (`kWp`), registered meters, last contact timestamp, 7-day daily energy trend, and meter status list.
- **Data:** Embedded 15-minute telemetry explorer scoped to the site.
- **Meters:** Site meter table and configuration actions (when opened from Settings).
- **PPA:** Contract terms and rates.
- **Connectivity:** VPN profile assignments for the site's meters.
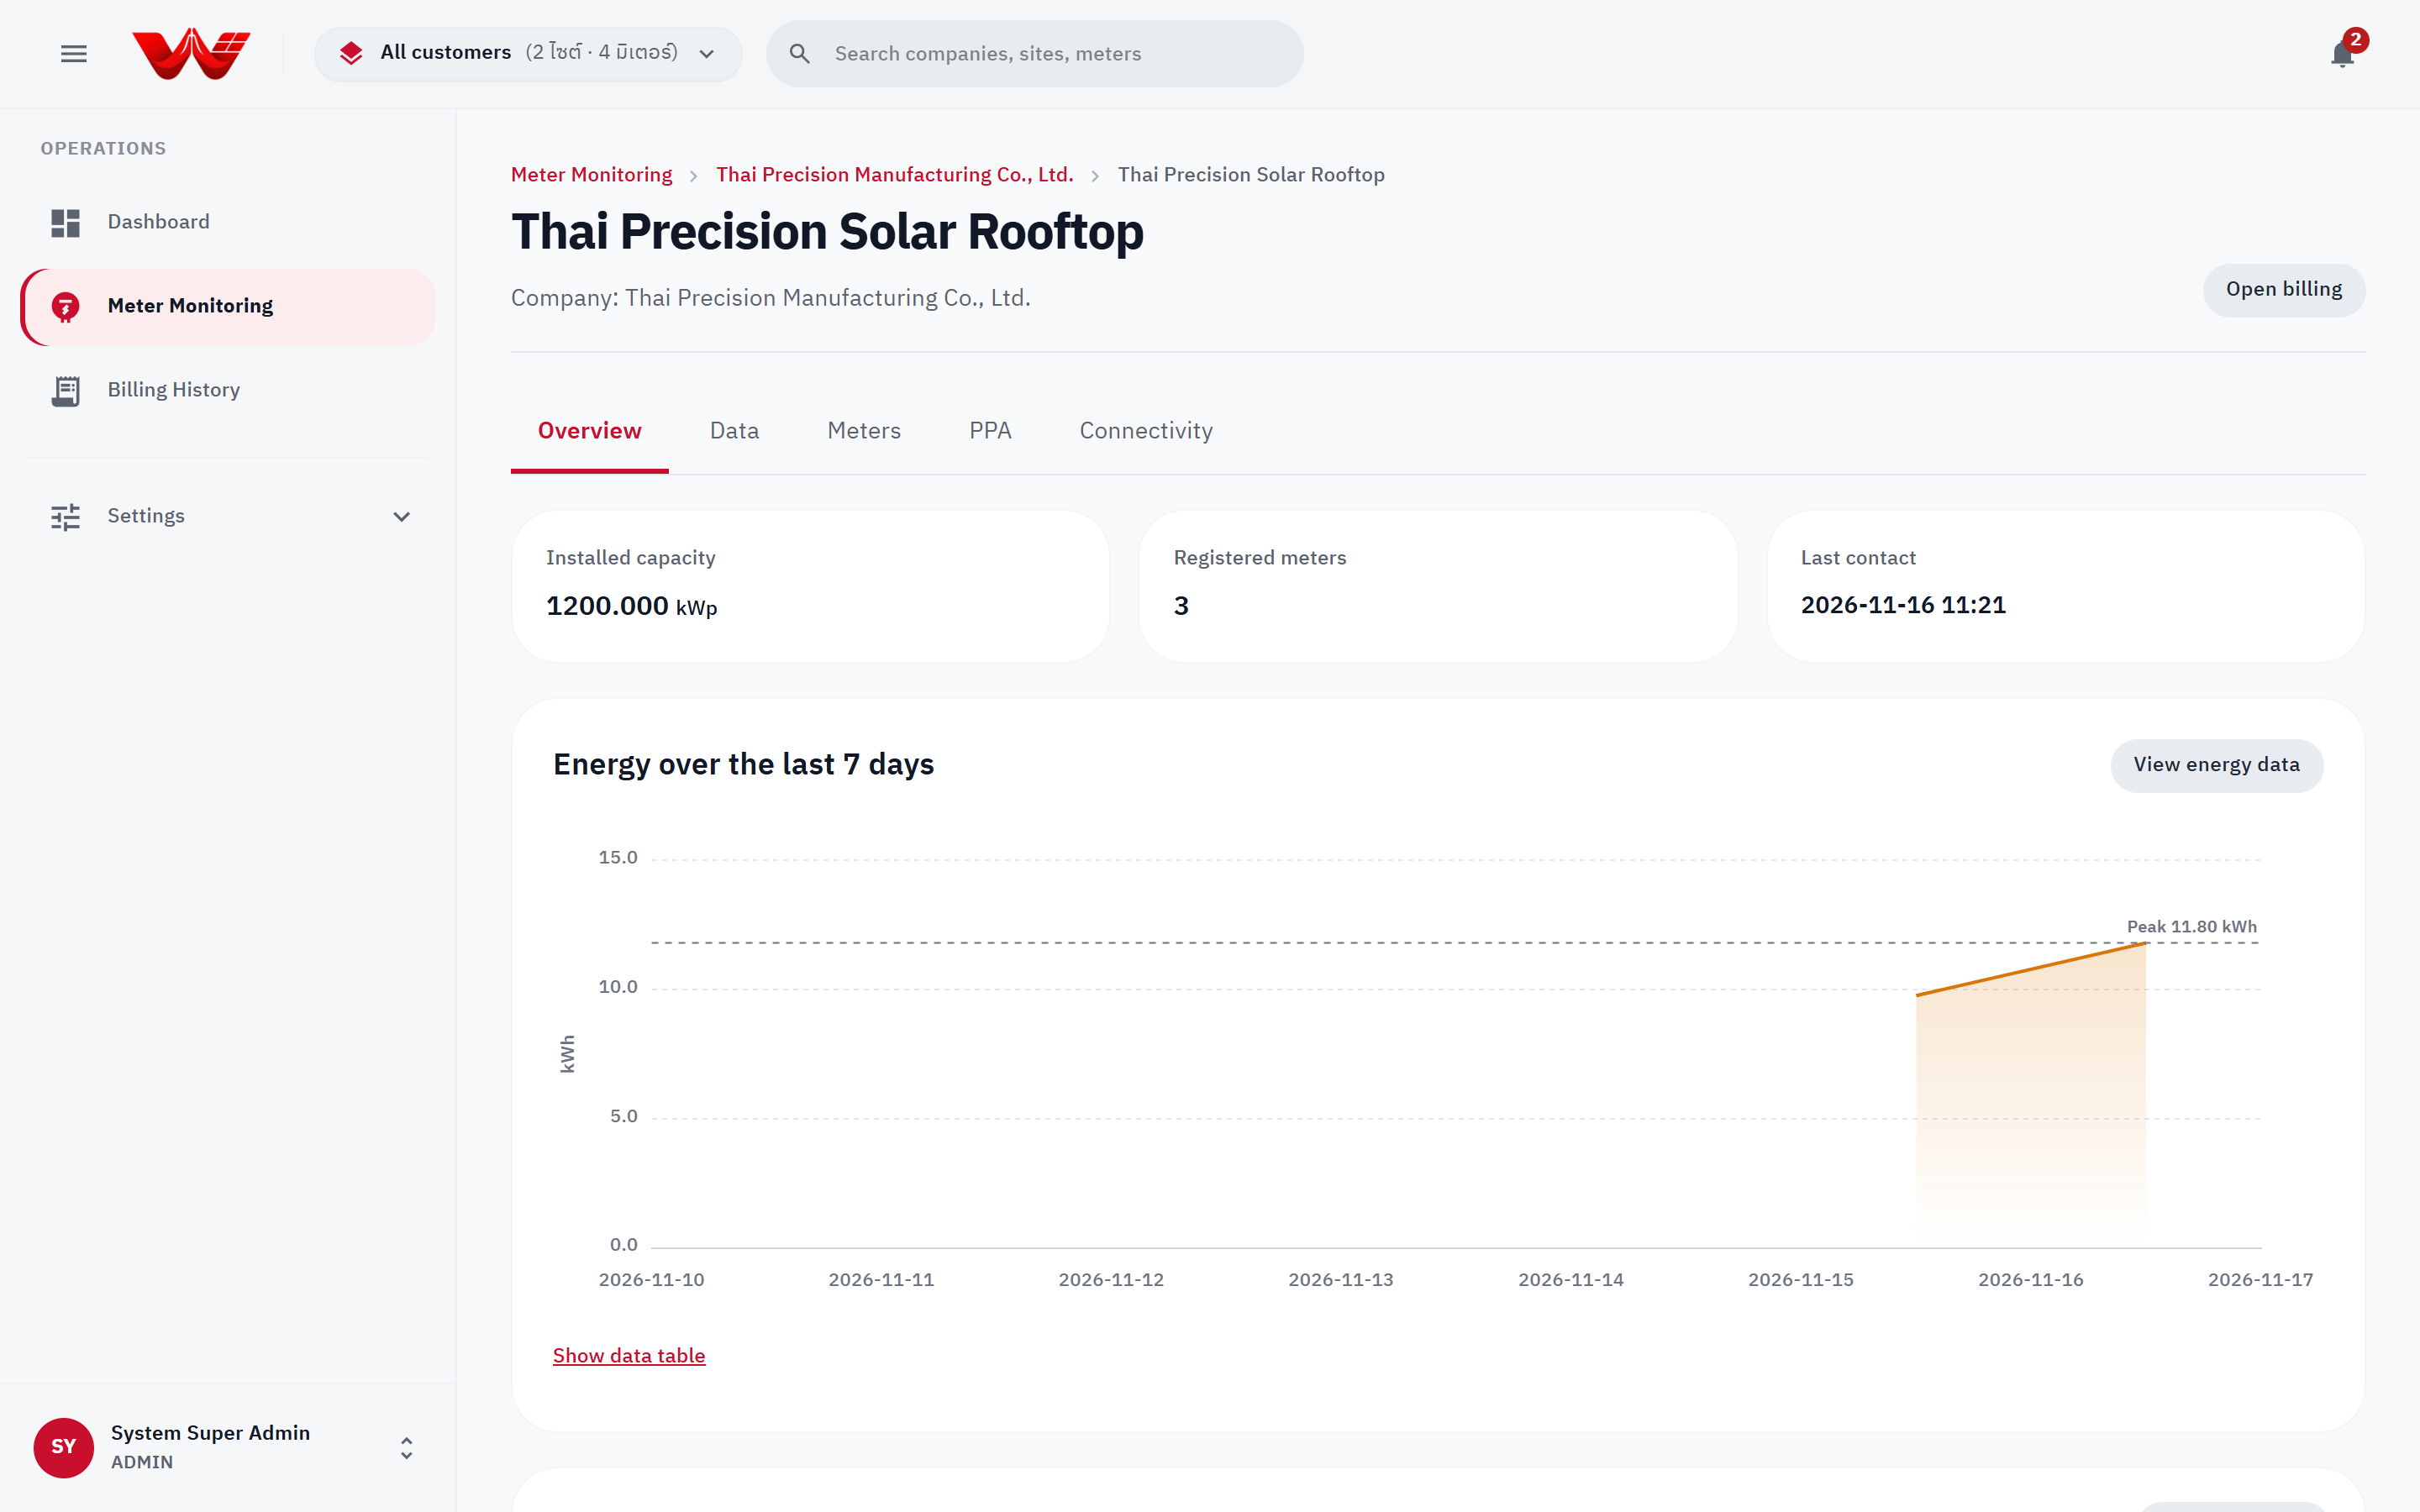
*Figure 3: Site overview displaying capacity, 7-day energy trend, and registered meters.*
### Meter Detail & Live HES Diagnostics
Click any meter to open its detail view (**Energy data** / **Configuration** and **Diagnostics**):
1. Review the top status banner explaining **why the meter is in its current state** and any **last HES error**.
2. Under **Commands** *(requires `meter.command`)*:
- Click **Test connection:** Sends a live probe through HES to verify network reachability, DLMS framing, and the LLS password. Results report latency (`ms`) or clear troubleshooting hints:
- `config_error`: No LLS password is configured on the HES host.
- `auth_failed`: The meter rejected the LLS password configured on HES.
- `Operation canceled / session timeout`: Meter was reached but did not answer; check `HDLC` vs `WRAPPER` interface selection.
- `poll_timeout / connect_failed`: Cannot reach the meter; verify IP/port, VPN/network, and meter power.
- Click **Read now:** Queues an immediate on-demand meter poll.
3. Inspect **Latest reading** (`kW`, cumulative `kWh`, `PF`, `Voltage`, `Current`), **HES communication** details, **Meter configuration** *(flags warnings if `CT × VT ≠ Multiplier` or if Reading side is `UNKNOWN`)*, and **Recent HES events**.
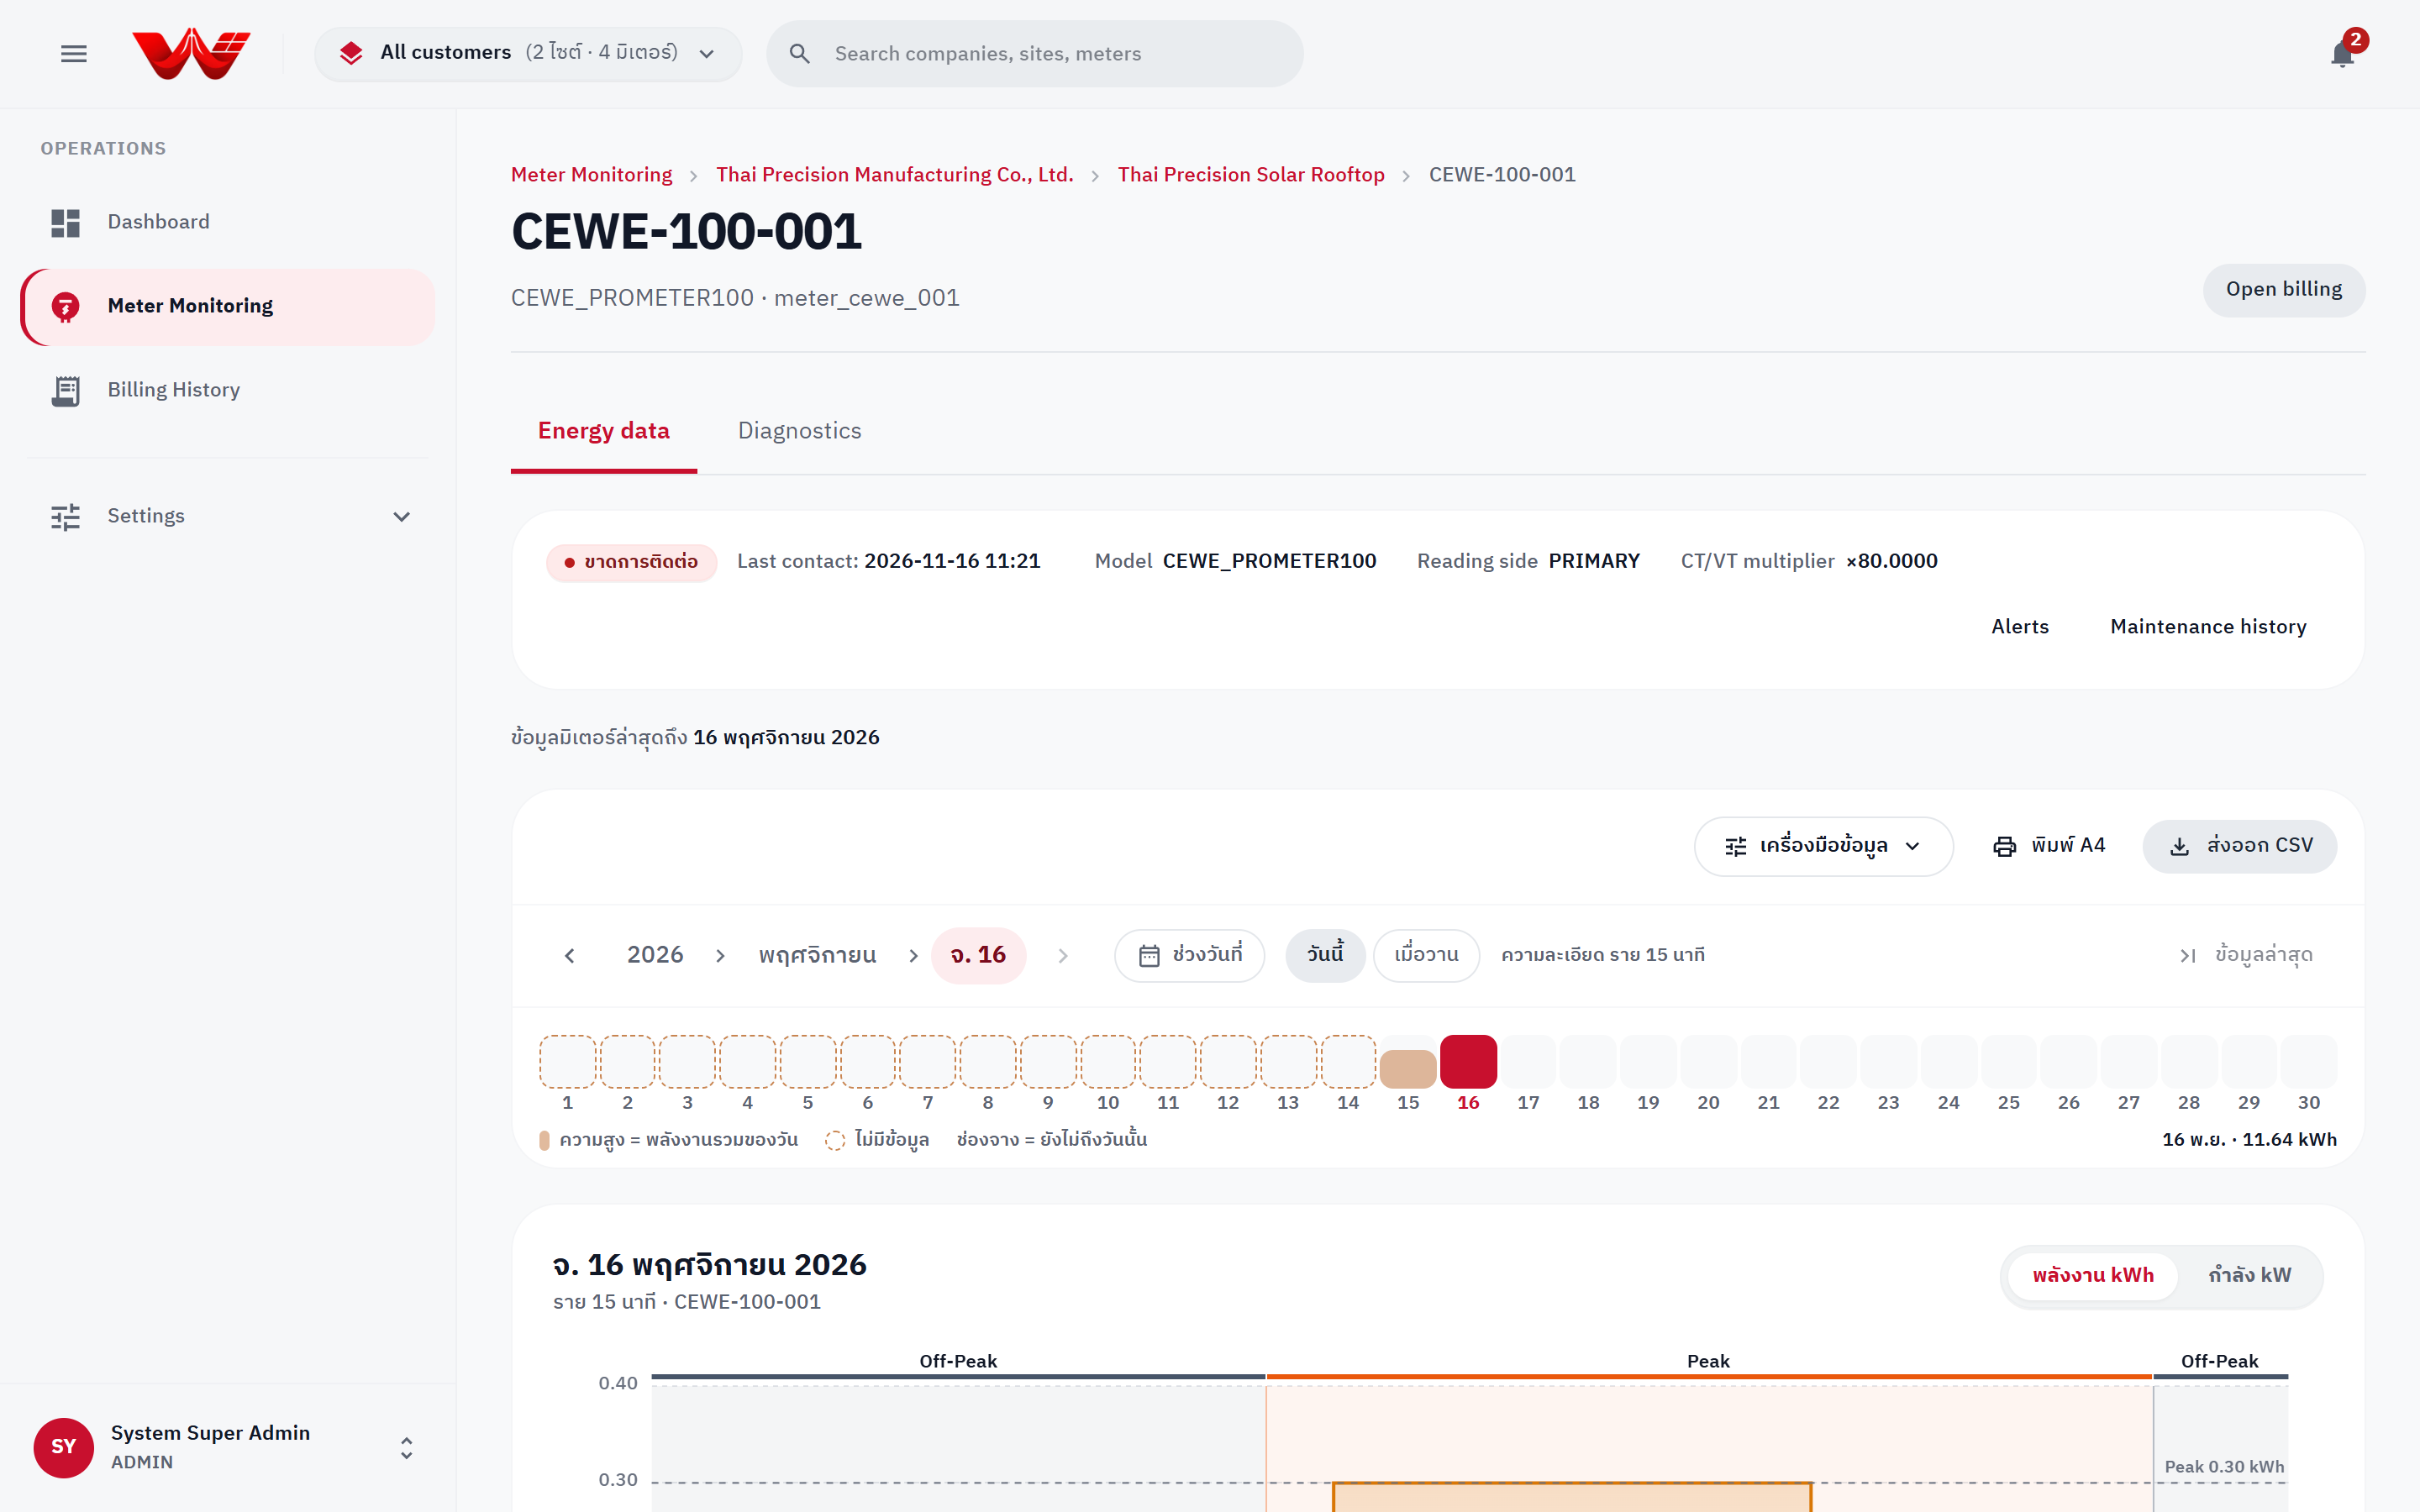
*Figure 4: Meter diagnostics view showing live probe commands, latest readings, HES comms, and CT/VT configuration check.*
---
## 3. Mid-Cycle Meter Replacement (`Replace Meter, SOW §79`)
When replacing a physical meter on site (due to failure or PEA statutory calibration rotation), **never delete the old meter**. Use **Replace** so historical readings stay intact and billing never double-counts energy:
1. Open the site under **Settings** > **Meters** *(requires `meter.write`)*.
2. Click **Replace** on the active meter being retired.
3. Set the **Effective swap date and time** to match the physical swap time (`activeTo` is recorded at this instant).
4. Choose an inactive **Replacement meter in this site** *(or select retire-only and register the replacement meter afterwards)*.
5. Enter the **Reason for replacement** (stored in maintenance and audit logs) and click **Confirm replacement**.
::: warning Activate Replacement Meters Separately in HES
Swapping **does not automatically activate** the replacement meter in HES. After confirming the swap, click **Activate in HES** on the warning banner (or the replacement meter row) and type its serial/ID to start scheduled polling. Also note that swaps cannot be backdated into months locked by `CHECKED` or `APPROVED` invoices.
:::
---
## 4. Exploring 15-Minute Telemetry (`View Data / Analytics`)
Open **View Data / Analytics** at `/view-data` (or via the **Data** tab inside any Site or Meter). All timestamps and calendar boundaries use **Asia/Bangkok (UTC+7)**.
### Navigating the Time Zoom Ladder
1. **Ladder breadcrumb:** Switch levels directly from the top bar:
- **Year** (e.g., `2026`): Monthly bars (click any bar to drill into that month).
- **Month** (e.g., `November`): Daily bars (click any bar to drill into that day's 15-minute intervals).
- **Day** (e.g., `Mon 16`): 15-minute curve (`00:00–24:00`) with an interactive monthly **Day Strip** above the chart showing daily energy bars and dashed missing-day indicators.
- **Date range:** Select custom dates or presets (**Last 7 days**, **Last 30 days**, **This month**, **Last month**) and choose resolution (**15 min** up to 7 days, **Hourly** up to 14 days, **Daily** up to 366 days, **Monthly**).
2. **Quick jumps:** Use `<` / `>` step arrows, **Today**, **Yesterday**, or **Latest data** to jump straight to the most recent day with meter readings.
3. **Metric toggle:** Switch between **Energy kWh** and **Power kW / Peak kW**.
### Reading the Chart, Markers & Data Table
- **TOU rate bands:** Background shading indicates **Peak** (Mon–Fri `09:00–22:00`), **Off-Peak** (Mon–Fri `22:00–09:00`), and **Holiday** (weekends & public holidays).
- **Waiting slots:** Hatched bars/rows indicate the interval's scheduled HES read window has not elapsed yet; the view refreshes automatically.
- **Missing intervals:** Highlighted warning rows summarize consecutive missing slots. WattDee **never fabricates `0`** for missing meter intervals.
- **Quality markers:** `Estimated` (interpolated/derived share across a communication gap) and `Under review` (meter event flag raised) badges appear on intervals, with source details on hover for roles holding `telemetry.quality.read`.
- **Site split & phase detail:** Multi-meter site views include a per-meter share breakdown; selecting a single meter also displays **PF**, **Voltage (V L1–L3)**, and **Current (A L1–L3)** columns when reported.
- **Export:** Click **Export CSV** (UTF-8 with BOM for clean Thai characters in Excel) or **Print A4**.
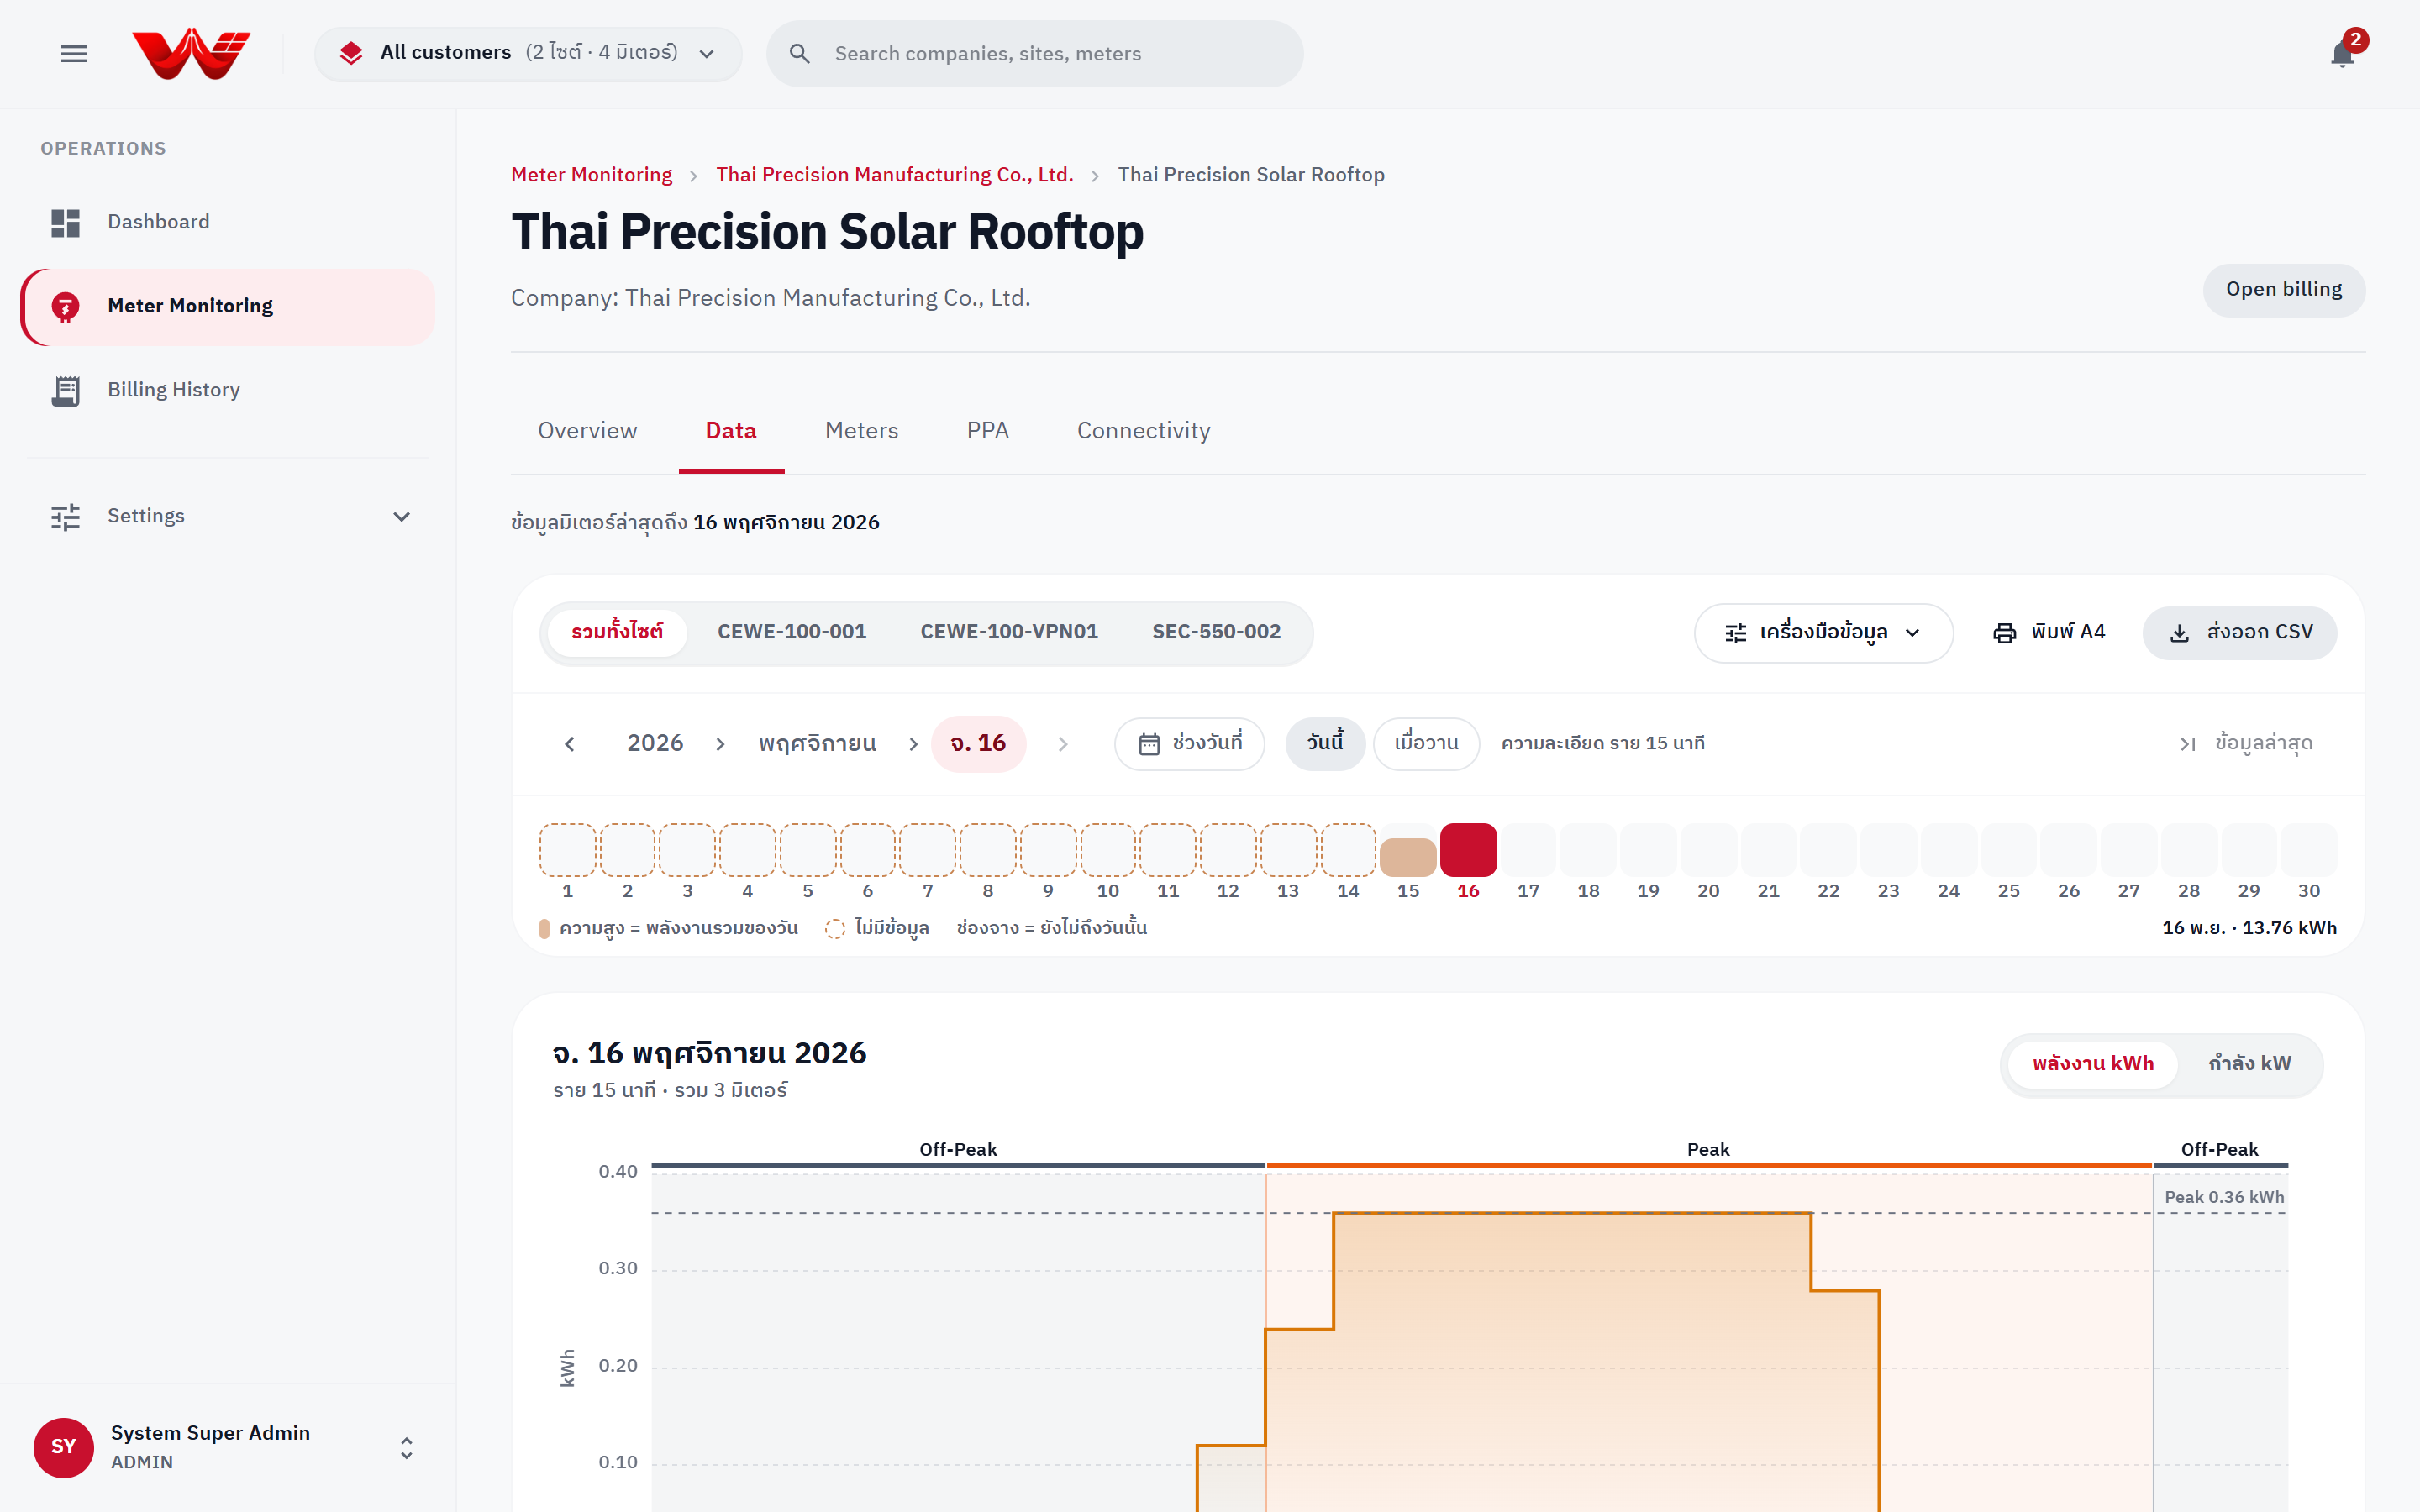
*Figure 5: View Data telemetry explorer with Zoom Ladder, Day Strip, TOU load curve, summary tiles, and 15-minute table.*
---
## 5. Data Tools: Quality & VEE Repair, Backfill & Period Compare
Click the **Data Tools** dropdown in the top-right toolbar of View Data to access three specialized panels:
### 1) Data Quality & VEE Repair
Everyone can inspect completeness metrics; repair actions require `telemetry.sync` (**Admin** or **O&M Engineer**):
- **Completeness summary:** Shows overall completeness (`%`), observed vs. expected 15-minute slots, and source breakdown (**Auto meter reads**, **Auto-estimated**, **Manual / CSV import**).
- **Auto-fill missing intervals:**
1. Select the meter and estimation method:
- **LINEAR:** Linear interpolation between the previous and next known points (recommended for short gaps).
- **ROLLING_AVG:** Historical rolling average for the same 15-minute slot from the preceding 7 days.
2. Click **Run auto-fill** *(fills empty slots only, never overwrites actual meter reads, and labels rows as `Estimated`, max 31 days per run)*.
- **Manual reading edit:**
1. Select the meter and a 15-minute aligned timestamp (`:00`, `:15`, `:30`, or `:45`).
2. Enter **Energy (kWh)**, **Average power (kW)** *(leave `0` to auto-calculate `kWh × 4`)*, **Reactive power (kVAR)**, and a **Reason** *(minimum 3 characters)*.
3. Click **Save changes** (all previous/new values and actors are logged in the meter's edit history).
- **CSV import:**
1. Choose the target meter and specify whether values are **Already net kWh** or **Raw meter values (apply CT/VT multiplier automatically)**.
2. Upload a `.csv` file or paste CSV lines with header `timestamp,active_energy_kwh,active_power_kw,reactive_power_kvar` (up to 5,000 rows per batch), enter a reason, and click **Import**.
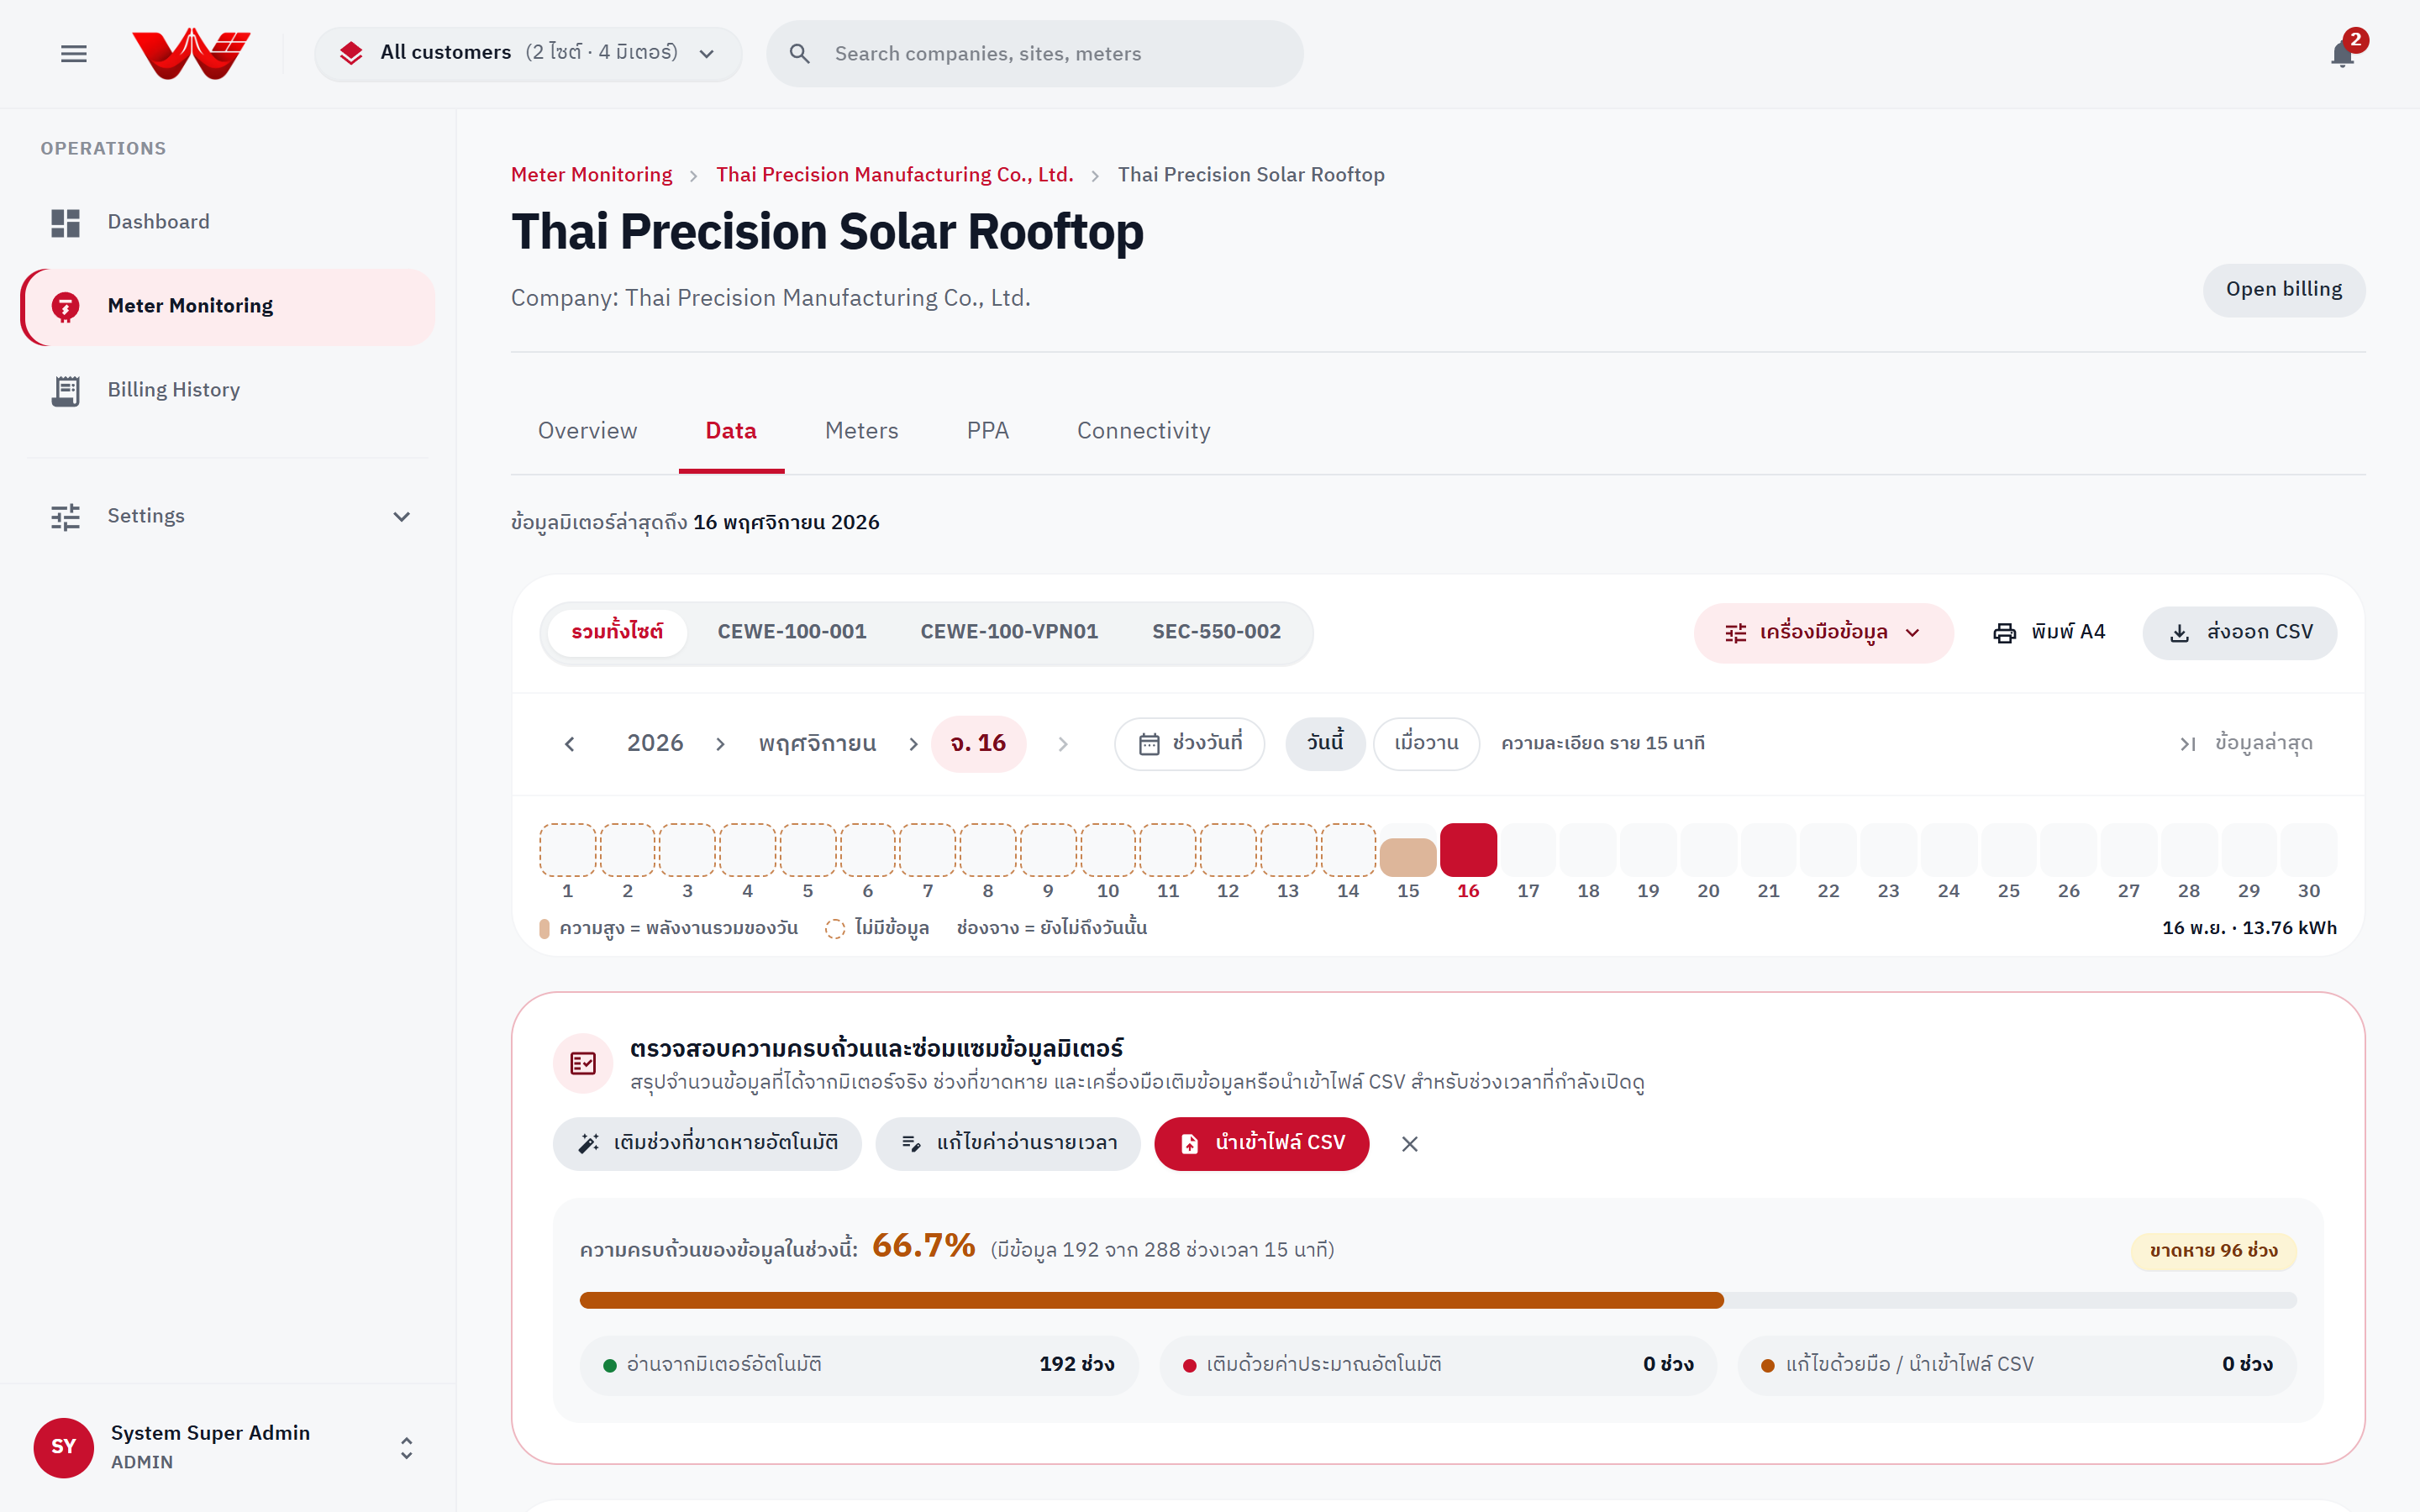
*Figure 6: Data Quality & VEE panel showing completeness bar, source breakdown, and Auto-fill / Manual Edit / CSV Import actions.*
::: warning Billing Period Lock Protection
Auto-fill estimation, manual edits, and CSV imports are **blocked (`409`) for any month that has a `CHECKED` or `APPROVED` invoice**. Ask Accounting to return or void the invoice before repairing telemetry in that period.
:::
### 2) Backfill from Meter (`meter.command`)
Requests HES to re-read the 15-minute load profile (`DLMS Profile Generic 1.0.99.1.0.255`) directly from the physical meter's memory:
1. Open **Data Tools** > **Backfill from meter**.
2. Select one or more meters and a Bangkok **From – To** date range *(maximum **31 days** per request, cannot include future dates)*.
3. Review the estimated slot count and click **Send request**.
4. HES processes the span in 7-day chunks and reports live progress (`Sending` → `Queued` → `Reading` → `Done` / `Failed`). You can close the drawer while commands finish in the background.
::: warning Backfill Overwrites & Draft Invoices
Recovered readings overwrite existing values in the requested span. If an open `DRAFT` invoice covers that month, it is flagged stale so Accounting knows to recalculate; months locked by `CHECKED`/`APPROVED` invoices hold changes safely in late-interval tracking.
:::
### 3) Compare Periods
1. Open **Data Tools** > **Compare periods**.
2. Pick a quick preset (**This month vs Last month**, **Last 7 days vs Prior 7 days**, **This year vs Last year**) or choose custom **Period 1** and **Period 2** date ranges.
3. Review the **Total Energy (kWh)** and **Peak Demand (kW)** delta cards alongside the side-by-side TOU breakdown table (**On-Peak**, **Off-Peak**, **Holiday**).
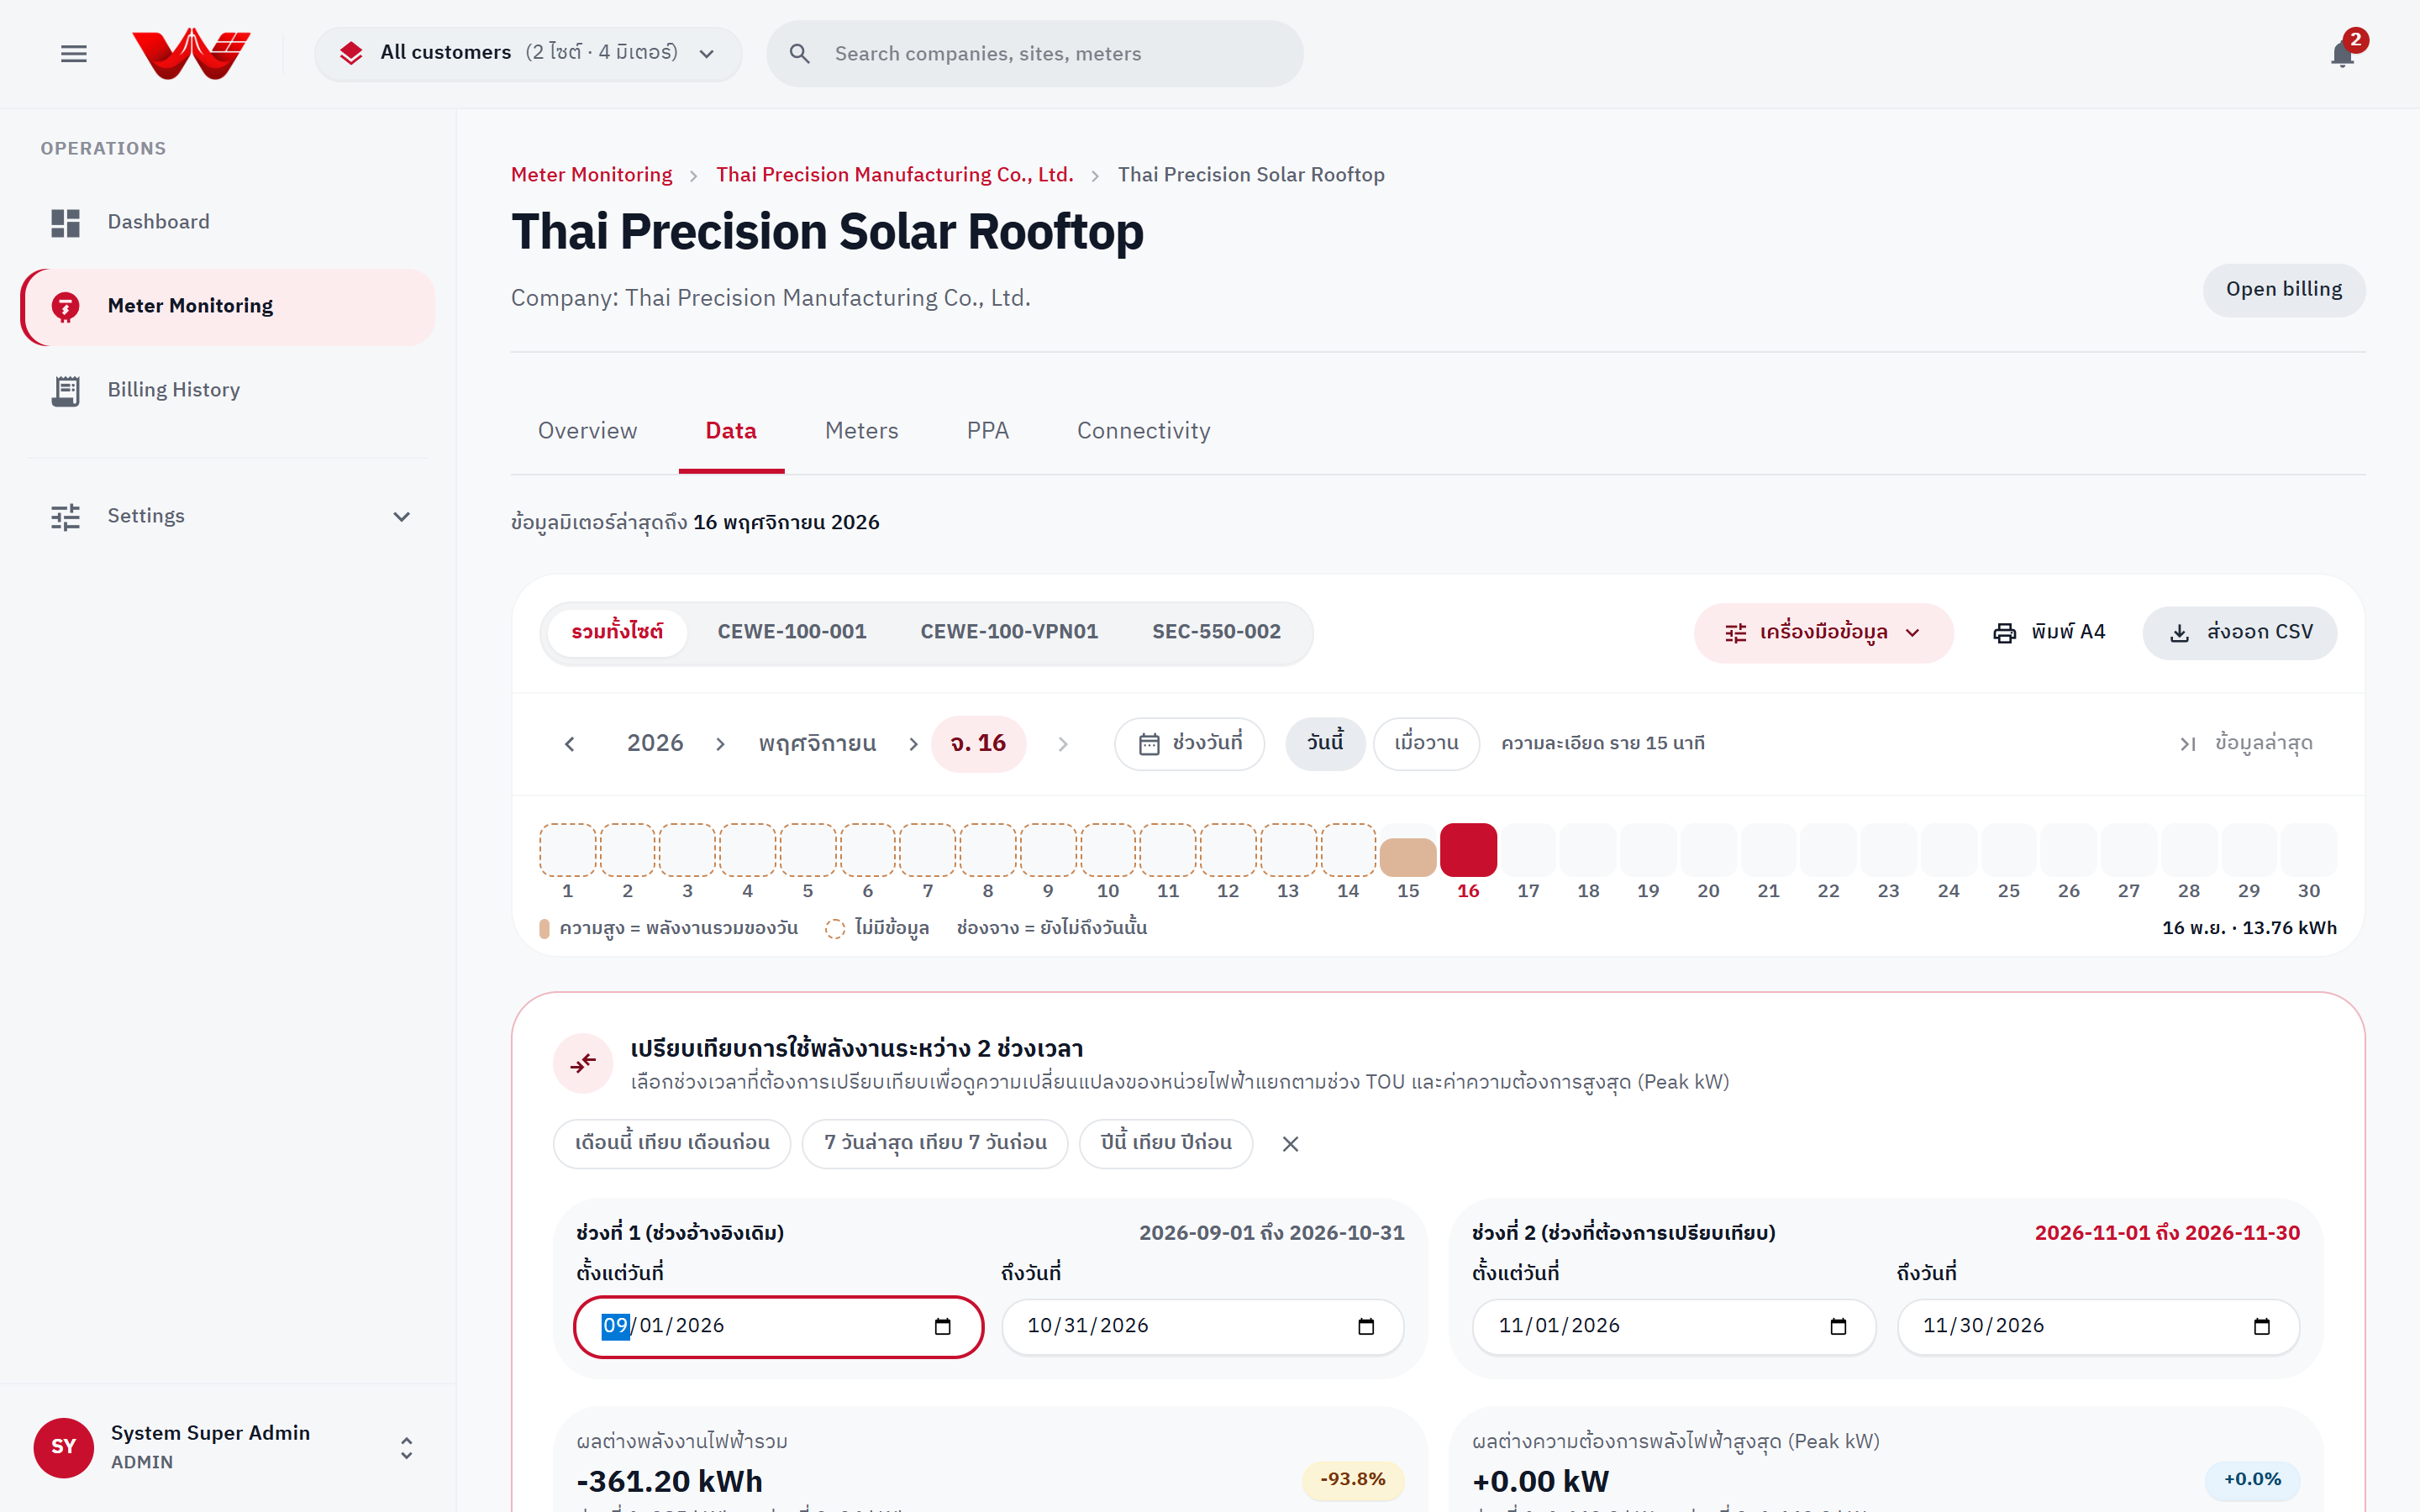
*Figure 7: Compare Periods panel showing kWh and Peak kW deltas across two selected date ranges.*
---
## Next Steps
- [Billing and 3-Tier Approval Guide](./06-billing-and-approval-guide)
- [Back to Roles and Permissions](./01-roles-and-permissions)